Round 2: synchronous short selling signals across multiple asset classes

1. Trading journal

2. Tip of the day: Triage, kick out the free loaders and never trade laggards

1. Trading journal: Round 2, time to short again and don’t complain there aren’t enough short ideas

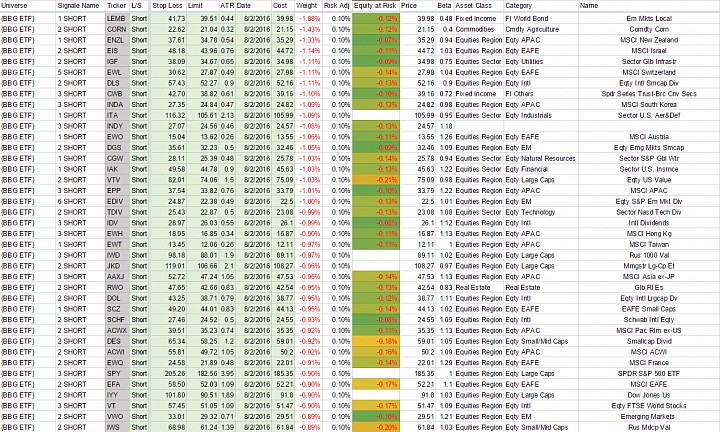
This is the big day, time to get back in the ring. Short squeeze came and went. Now, stocks are rolling over again. This is quite an unusual to do so though. Roll-over usually happen over the course of a week. This time, it’s different (just love to say that to confuse people).Roll over happens across asset classes on the same day. In fact, there were so many they had to be split in two files. It took more than an hour and almost half a bottle of Prosecco to process them. So, don’t complain there aren’t enough short selling ideas.

So, “is it the right time to dip our toes in the water ?” When everyone is buying, short selling seems like a bad idea. By the same token, when everyone around the world, across asset classes is selling, does it sound like a good idea to go out and buy ?

If You want details on any signal, send a mail or a comment and i will post it with comments.

All signals are ranked by size assuming a 0.10% risk per trade. I placed a whole bunch of orders. The priority algo was as follows:

  1. Free up some space and kick out free loaders: see Tip of the day
  2. Top-up of existing positions: SPY, EWL, EWH, EPP, PHO, VWO. Ignore EWA, IDV and TDIV already fully loaded or expensive borrow
  3. Enter qualified trend reversals: we have designed a neat trend reversal qualification test some time ago. This is as early and as safe as a trend reversal can be detected. So, anchor positions with minimum risk per trade very near the top
  4. Enter trending shorts by size and lot numbers: the bigger the size and the higher the number of lots the better. High lot number means easier partial exit

Tip of the day:

Triage:

  1. Make space, get rid of stale positions: multiple simultaneous positions means something happened in the markets. So, the first thing to do is to get rid of the positions that did not react. Those that do not react are likely to hurt when the market moves the other way. For example, during this sell-off, some positions held their ground. Two of them even went up. Fine, OUT now. Yeah but the thesis, the long term prospect, blah blah blah. Sure, when ready to cooperate, we will talk about it, but for now OUT. This frees out some resources to more promising ideas
  2. Weight ranking: position sizing algo is fixed fraction position sizing of equity at risk -0.10%. So, for the same risk budget, the bigger the position size, the lower the volatility. Yeah, but i like the thesis on bio stocks. Great, they are too volatile still, so wait until they are ready for a serious relationship

Free Loaders:

Managers often fail to meet their objectives not because of spectacular blow-ups, but because of the drag of poor performing stocks. So, relentlessly kick out stocks that do not react or perform poorly. Here is a simple powerful way to reframe the situation

If You owned a building, would You allow tenants to stay rent free ? No, You expect them to pay their rent. Apply the same discipline to stocks and performance will mechanically improve. Here is a simple elegant “how to” article

http://alphasecurecapital.com/the-game-of-two-halves-an-eleg…

Never trade laggards

Brokers and fund managers have this constant fear of missing the boat (fear of missing out or FOMO). So, they have come out with this brilliant idea to round up thematic stocks and identify laggards. The basic thought is “This is the next…”. IBM is not the next Apple, Squarespace is not the next Facebook. Laggards are just left overs

The best remedy is to think that the boat You just missed is not an ocean liner but a Vaporetto. There will be another one shortly. The market will give You another chance

Trading Journal 20160203

Trading Journal 20160203

1. Trading Journal

2. Tip of the day

Trading Journal

As explained in a previous post, Shorts entered after a squeeze offer better visibility and have higher probability of success. So, the alert pad came back quite full. Most of the signals are frequent flyers on the short side.

Shorts are like a glasses of wine, they tend to be depleted, so they require regular top-ups. Let:s not complicate things here.

Here is how to read the above table

  1. Stop Loss: it has a dual function, one obviously to put a quick end to a bad trade for now. The second function of a stop loss is to calculate a position size. Those are isometric staircase stop loss using a multiple of ATR 2.5 or 2.6
  2. Limit: Entry is a choice, exit is a necessity. This has been severely back-tested and reinforced in real life trading: this strategy works best over time if we do not chase stocks. Stop Loss and Limit are used to calculate position size
  3. ATR: Average True Range 20 days, simple average.
  4. Weight: suggested position size. This is a Fixed Fractional Position Sizing method or equity at risk that assumes -0.10% risk per trade. This is a clean simple multiplier
  5. Risk Adjustment: this is the -0.10% factor
  6. Equity at risk: position sizies are rounded to the nearest lot and this gives residual equity at risk
  7. Ranking order: the bigger the better. For a same risk budget, the trade suggesting the largest size comes first. There is no “qualitative/fundamental” assessment here. Size is a primarily a reflection of the volatility signature

For the record, I have placed orders on some of those ETFs. I am not suggesting You should buy/sell/short sell or buy to cover any of those signals.

As You can see, the numbers at the right side of the charts are the same as the ones on the table. In fact, I go through every chart and write those numbers.

SJNK is another junk bond ETF. It has low volatility and clean trend. Those are rare and nice shorts: bearish calm

On the Long side, the information is below the swing point. Interestingly enough, the algorithm flagged a partial exit shortly before this re-entry. Re-entries are possible only after a partial exit has been performed.You

The logic is simple: take risk off the table before adding some. Adding to a position with open risk compounds risk. It works until it does not


Tip of the day

Whatever asset class and time frame, we all trade the same thing: risk. So, the first order of business after entry is to reduce risk.

Trading Journal 2016/01/20

This is a test. If You find value in this trading journal, please let us know. If there are topics You would like to see covered, please comment and suggest. This journal exists only because You find it useful. So, help us create something You need.

1. No signals today

2. Trading activity Last night. Risk at this stage of a sell-off

3. General considerations:

  1. The vaporetto has left, there will be one coming soon: don’t short now, wait for the squeeze
  2. TIP of the day: counter-interintuitive truths about crowded shorts and performance during sell-offs (must read for novice short sellers)
  3. Position for the squeeze and beyond

Trading

Last night there was another Short EPOL, the ETF for Poland.

Here is how to read the chart:

Direction: Short. Comment: Trend is clearly fast bearish with low volatility. That trade has packed a lot of octane (reward to risk / holding period)

Stop Loss: 18.18

Target price: 15.97

Max Risk Per Trade suggested: -0.39% ( per convexity algo, not the standard -0.10% that will give readers a clean multiple). That is 95% of risk per trade

Trading Journal

RIsk: I elected to allocate -0.29% of risk. Risk is a number, not a dissertation. These are the reasons:

Pros:

  1. This is the third tranche. There is embedded risk free P&L of 0.53% that gives some cushion.
  2. More importantly, the lot size is such that only a small move is necessary to be able to cover a large portion and subsequently break even. It needs to generate 0.08% in order to reach break even level
  3. Current position before trade is getting small. It needs to be replenished

Cons:

  1. Trend is maturing. Borrow cost has increased accordingly. This is the third tranche in less than 4 months. Time for a break maybe ?
  2. Correlation increasing across asset classes, synchronous shorting is dangerous, so tone down the risk, take off -0.05%
  3. Rebound was small in duration and magnitude. It may be a false positive. In those fast trend it is either mid section, either before the rebound, take off -0.05%

Verdict: take the trade, but because of synchronous sell-off, reduce risk

3. General market considerations

If You haven’t shorted yet, it is too late. Vaporetto has left. Do not jump onboard now, You’ ll drown and feel stupid. Be patient, keep your powder dry.

Time is better spent observing the markets and observing your thoughts. Journal your thoughts. Observe the monkey on your shoulder.

Homework: this is a great time to get ready for the next campaign: (I have a system so I don’t need to do this anymore), but here is what I would look for: the weakest stocks that are not heavily shorted. Those are the stocks that Long holders sell.

Now is the time to think about the upcoming squeeze and beyond

The probability of a squeeze increases day by day. It is about time for a bit of mouth flapping. They call it reassuring the markets these days.

When they turned off free monetary booze, they expected a bit of weening turbulence, some whining, so no big deal so far.

Now that the vaporetto has left, let’s wait. When the squeeze comes, cover positions (half if You don’t have a system), or break even level if You use a similar equation as mine.

There is no need to cover it all. Markets have turned bearish, so the idea is to cover a portion, ride the squeeze and then slap another tranche.

Roadmap

When the squeeze is over, I will gross-up my leverage. At 127% Gross, -62% net, -22% net at risk today, I am under-participating. The idea was to start the year slow, build some performance cushion and gross up gradually. Bad idea to start sprinting at the beginning of a marathon.

So, when the squeeze comes, net at risk should drop to sub -10%. After the squeeze, gross up so that the net at risk be around -50/60%. This should be a gross of roughly 180-200% .

Now, life is usually what happens when You had other plans.

TIP of the Day: counterintuitive truth about short selling

You will usually find an inverse correlation with borrow utilisation level and performance in sell-offs. In other words, stuff that is heavily shorted all year round holds its ground during sell-off. Money is not made shorting the same stocks everyone shorts: Elvis has already left the building.

Money is made spotting the stocks that are not heavily shorted but underperform the markets. It makes counterintuitve sense: the market participants selling are Long holders selling their positions. Information has not traveled yet

These are the guys we will stalk, these are the guys whose coat we will tail. They are going through a process of grief: Denial, Anger, Bargaining, depression and acceptance. I quantified the process a few years ago. In fact, it was my first public speaking opportunity.

More about this and the Kubler Ross grief model applied to the markets on my website at www.alphasecurecapital.com . Please subscribe, It keeps me motivated. It is free and has resources for committed traders.

Conversely, make a note of the heavily shorted stuff that outperforms or holds its ground. This is squeeze box material where all the structural short sellers go impale themselves.

Daily #ETF signals

Thought of the day: “Sometimes by kising a battle, You find a new way to win the war”, Donald Trump, Happy Birthday

  1. VXX Bearish strength
  2. SCZ Bullish Weakness
  3. JKD Bullish Weakness
  4. IYF Bullish Weakness
  5. EWJ Bullish Weakness
  6. DFJ Bullish Weakness
  • Complexity is a form of laziness
  • Great traders are not smarter, they have smarter trading habits
  • If investment is a process, then automation is a logical conclusion
  • If You are interested in short-selling, trading systems, position sizing, trading psychology, visit us at: www.alphasecurecapital.com
  • Bullish weakness: Longer-term trend is bullish. There has been some temporary weakness, but the uptrend is likely to resume
  • Bearish strength: Longer-term trend is bearish. There has been some temporary rally, but the downtrend is likely to resume
  • Volatility Channels (Horizontal dotted lines) : Markets often retest swings. This is a volatility buffer to allow wiggle room.
  • Volatility Channel: Think of the other side of a volatility channel of the distance it would take to close half the position to break even if the remainder was to hit the stop loss
  • #n%: Think of it as a rudimentary equity at risk position sizing. It is 1% divided by the distance from the day the swing is recorded to the volatility channel
  • Disclaimer: this is neither a solicitation, nor an investment advice


Daily #ETF signals

Thought of the day: “Make bold choices and make mistakes. It’s all those things that add up to the person you become”, Angelina Jolie, Happy Birthday

  • Great traders are not smarter, they have smarter trading habits
  • If You are interested in short-selling, trading systems, position sizing, trading psychology, visit us at: www.alphasecurecapital.com
  1. EWGS Bullish Weakness 2015-06-04 17.40.35.png
  2. UDN Bullish Weakness 2015-06-03.png
  3. EWO Bullish Weakness 2015-06-03.png
  4. EWI Bullish Weakness 2015-06-03.png
  5. UUP Bearish Strength 2015-06-03.png
  6. TLT Bearish Strength 2015-06-03.png
  7. TFI Bearish Strength 2015-06-03.png
  8. MBB Bearish Strength 2015-06-03.png

  • Bullish weakness: Longer-term trend is bullish. There has been some temporary weakness, but the uptrend is likely to resume
  • Bearish strength: Longer-term trend is bearish. There has been some temporary rally, but the downtrend is likely to resume
  • Volatility Channels (Horizontal dotted lines) : Markets often retest swings. This is a volatility buffer to allow wiggle room.
  • Volatility Channel: Think of the other side of a volatility channel of the distance it would take to close half the position to break even if the remainder was to hit the stop loss
  • #n%: Think of it as a rudimentary equity at risk position sizing. It is 1% divided by the distance from the day the swing is recorded to the volatility channel
  • Disclaimer: this is neither a solicitation, nor an investment advice

Daily #ETF signals

Thought of the day: “Follow your own inner moonlight, do not hide the madness”, Allen Ginsberg, Happy Birthday

  • Great traders are not smarter, they have smarter trading habits
  • If You are interested in short-selling, trading systems, position sizing, trading psychology, visit us at: www.alphasecurecapital.com
  1. USO Bullish weakness 2015-06-02.png
  2. INDA Bearish strength 2015-06-02.png
  3. IEF Bearish strength2015-06-02.png
  4. BNDX Bearish strength 2015-06-02.png
  5. BLV Bearish strength 2015-06-02.png
  6. BIV Bearish strength 2015-06-02.png

  • Bullish weakness: Longer-term trend is bullish. There has been some temporary weakness, but the uptrend is likely to resume
  • Bearish strength: Longer-term trend is bearish. There has been some temporary rally, but the downtrend is likely to resume
  • Volatility Channels (Horizontal dotted lines) : Markets often retest swings. This is a volatility buffer to allow wiggle room.
  • Volatility Channel: Think of the other side of a volatility channel of the distance it would take to close half the position to break even if the remainder was to hit the stop loss
  • #n%: Think of it as a rudimentary equity at risk position sizing. It is 1% divided by the distance from the day the swing is recorded to the volatility channel
  • Disclaimer: this is neither a solicitation, nor an investment advice

Daily #ETF signals

Thought of the day: “The task of the leader is to get his people from where they are to where they have not been”, Henry Kissinger, Happy Birthday

  • Great traders are not smarter, they have smarter trading habits
  • If You are interested in short-selling, trading systems, position sizing, trading psychology, visit us at: www.alphasecurecapital.com
  1. EPU Bearish Strength
  2. EWM Bearish Strength
  3. UNG Bearish Strength 2015-05-27.png


  • Bullish weakness: Longer-term trend is bullish. There has been some temporary weakness, but the uptrend is likely to resume
  • Bearish strength: Longer-term trend is bearish. There has been some temporary rally, but the downtrend is likely to resume
  • Volatility Channels (Horizontal dotted lines) : Markets often retest swings. This is a volatility buffer to allow wiggle room.
  • Volatility Channel: Think of the other side of a volatility channel of the distance it would take to close half the position to break even if the remainder was to hit the stop loss
  • #n%: Think of it as a rudimentary equity at risk position sizing. It is 1% divided by the distance from the day the swing is recorded to the volatility channel
  • Disclaimer: this is neither a solicitation, nor an investment advice

Daily #ETF signals

Thought of the day: “Do not go where the path may lead, go instead where there is no path and leave a trail”, Ralph waldo Emerson, Happy Birthday

  • Great traders are not smarter, they have smarter trading habits
  • If You are interested in short-selling, trading systems, position sizing, trading psychology, visit us at: www.alphasecurecapital.com
  1. WIP Bearish Strength
  2. AAXJ Bullish Weakness

  • Bullish weakness: Longer-term trend is bullish. There has been some temporary weakness, but the uptrend is likely to resume
  • Bearish strength: Longer-term trend is bearish. There has been some temporary rally, but the downtrend is likely to resume
  • Volatility Channels (Horizontal dotted lines) : Markets often retest swings. This is a volatility buffer to allow wiggle room.
  • Volatility Channel: Think of the other side of a volatility channel of the distance it would take to close half the position to break even if the remainder was to hit the stop loss
  • #n%: Think of it as a rudimentary equity at risk position sizing. It is 1% divided by the distance from the day the swing is recorded to the volatility channel
  • Disclaimer: this is neither a solicitation, nor an investment advice

Daily #ETF signals

Thought of the day: “The world is full of magical things waiting for our wits to grow sharper”, Bertrand Russell, Happy Birthday

  • Great traders are not smarter, they have smarter trading habits
  • If You are interested in short-selling, trading systems, position sizing, trading psychology, visit us at: www.alphasecurecapital.com
  1. URA Bullish Weakness
  2. TAN BUllish Weakness
  3. PNOI BUllish Weakness
  4. PBJ Bullish Weakness
  5. IWP Bullish Weakness
  6. IPAC Bullish Weakness
  7. IJT Bullish Weakness
  8. IJK Bullish Weakness
  9. IAU Bullish Weakness
  10. GRN Bullish Weakness
  11. DOI Bullish Weakness
  12. CSD Bullish Weakness

  • Bullish weakness: Longer-term trend is bullish. There has been some temporary weakness, but the uptrend is likely to resume
  • Bearish strength: Longer-term trend is bearish. There has been some temporary rally, but the downtrend is likely to resume
  • Volatility Channels (Horizontal dotted lines) : Markets often retest swings. This is a volatility buffer to allow wiggle room.
  • Volatility Channel: Think of the other side of a volatility channel of the distance it would take to close half the position to break even if the remainder was to hit the stop loss
  • #n%: Think of it as a rudimentary equity at risk position sizing. It is 1% divided by the distance from the day the swing is recorded to the volatility channel
  • Disclaimer: this is neither a solicitation, nor an investment advice

Daily #ETF signals

Thought of the day: “In theory, there is no difference between theory and practice. In practice, there is”, Yogi Berra, baseball philosopher, Happy Birthday

  • Great traders are not smarter, they have smarter trading habits
  • If You are interested in short-selling, trading systems, position sizing, trading psychology, visit us at: www.alphasecurecapital.com
  1. IAI BUllish Weakness 2015-05-11
  2. DFJ Bullish Weakness 2015-05-11
  3. ASHR Bullish Weakness 2015-05-11


  • Bullish weakness: Longer-term trend is bullish. There has been some temporary weakness, but the uptrend is likely to resume
  • Bearish strength: Longer-term trend is bearish. There has been some temporary rally, but the downtrend is likely to resume
  • Volatility Channels (Horizontal dotted lines) : Markets often retest swings. This is a volatility buffer to allow wiggle room.
  • Volatility Channel: Think of the other side of a volatility channel of the distance it would take to close half the position to break even if the remainder was to hit the stop loss
  • #n%: Think of it as a rudimentary equity at risk position sizing. It is 1% divided by the distance from the day the swing is recorded to the volatility channel
  • Disclaimer: this is neither a solicitation, nor an investment advice