Posts

Why is humility an essential trait of profitable short-sellers ?

January 2016 was a difficult month for investors. According to Barry Ritholtz:s, 93% of investors lost money. Feeling helpless and crushed while watching your investments melt away is a terrible feeling that takes a devastating toll on emotional capital. There can’t possibly be anything worse feeling, except perhaps a skill aspiring short sellers have to master, humility.

If You want to profit from a bear market and if You want to hold your short positions long term, then You probably should read this article.

Turning away from the gates of Valhalla

In January, my performance roared out of the gate. i was up at around +5.9% mid-month. i was timidly positioned for a cautious slow start with a gross around 150% and -0.12% risk per trade. Despite being ridiculously conservative and vastlyunder-participating, performance was there day after day. Returns were not only one-sided either. It was quality performance : Longs pulled their weight too: sugar, gold, Fixed income, Forex USD Bull. This is the stuff hedge funds are made off. i have long argued that the secret to AUM is to perform when no-one else does. This was it. And then, i saw it coming. i even wrote a post about it on the first day it happened, January 20th . A short-squeeze was under way. At this point, i could have closed all positions, walk away with +5.9% and be the one who closed right at the bottom. The gates of heaven were opening: Valhalla, shiny and chrome.

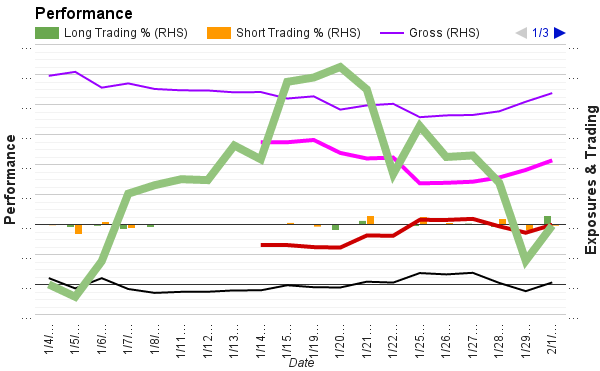
But then, i did the unthinkable. i went to work, methodically reducing bet sizes. i chose to take as little profit as necessary. i chose to forfeit all those profits and promises and then sat by the side of the road, waiting for the market to humble me all over again. And sure enough it did. It peeled off rock star returns, money for my family, fame, marketability, anything anyone would have aspired for. By the time Mrs Market was done with me, i had lost 90% of my gains: i went from +5.9% to +0.59% in less than a week. i was humbled alright, but i ended up profitable still. More importantly, I am better positioned now for round 2. Humility is a critical skill and below are the lessons from my journey

Two certainties in life: death and short squeezes

There are two certainties in life: death and short squeezes. There is no way to predict how long, how brutal short squeezes will turn. Why they happen is irrelevant: exhaustion of selling pressure, irrelevant but reassuring good news, government gesticulation, monetary intervention. Whatever the reasons, short squeezes are part of the short landscape and i have to deal with them.

Someone told me that short selling a stock at $1 can still yield a juicy 50% return if it drops to 50 c. True, at least in theory. The real question is would he still be there after price rallied from 52 c. to 70 c., or 30% in 4 days ? Very few people have the testicular fortitude to hold steady. i don’t, and this is why i have developed a methodology that enables to ride short squeezes.

The triple R methodology to weather a short squeeze

Short squeezes happen with 100% certainty. It is not about if, only about when. Rather than thinking of them as pestilence, i came to appreciate them and make good use of them. After all, they provide good entry points, plentiful borrow and flush amateurs (it is hard to feel sympathy for impatient people who jump in the water after vaporetti). Without further ado, here is the triple R methodology:

  1. Reduce: bet sizes as soon as You perceive a short squeeze
  2. Ride the squeeze. Do not short sell on the way up, but trim Longs that got clobbered in the downturn
  3. Reload: once the squeeze fades: lower stop losses and top-up existing positions

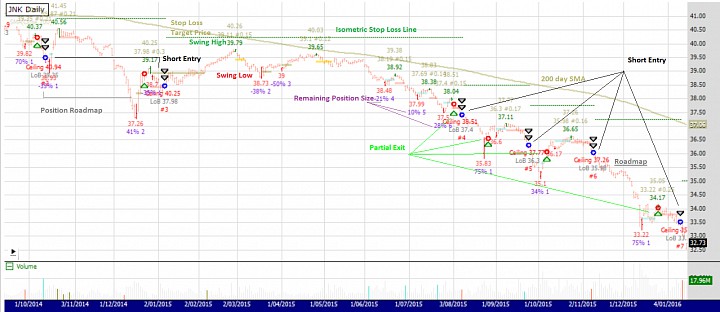
In practice, it looks like the chart below:

Reduce

i am a trend follower. My objective is to ride positions as long as trends are valid. So, as soon as i see a squeeze coming, i reduce risk. i cannot control how vicious and how long they will last, but i can control how much damage they will inflict to the portfolio. So, the first step it to reduce bet sizes, so as to capture some profit and reduce subsequent potential damage.

Whether You trade German Bunds, US equities or colorful language with your significant other, You deal in one thing: risk. Risk is not a story. Risk is number. Since there is no way to predict how unpleasant a squeeze will be, it is prudent to bring risk to neutral as soon as You see it happening

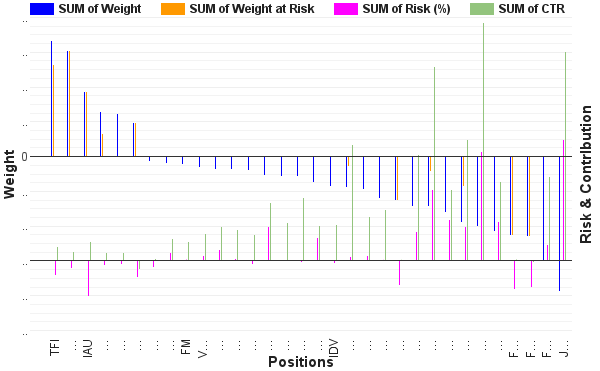
Above is a picture of my portfolio in late January:

  1. Open Risk (pink bars) = Shares * (Cost – Stop Loss) / NAV
  2. CTR (Contribution, light green) = [Shares * (Price – Cost) + Realised P&L] / NAV (Scale out model, hence realised P&L)
  3. Weight (blue bars) = Market Value / NAV
  4. Weight at risk (orange bars) is weight (blue) where Open Risk (pink) is still negative

In simple terms, i try to bring the orange bars to neutral. At the onset of a squeeze, my objective is to have as many positions as possible with a neutral or positive risk carry. There are several ways to do it, but if You are new to the method, just halve your positions. Example: if You have -0.50% open risk and +0.25% profit, halving the position will reduce risk by a factor of 4: from -0.50% to -0.125%.

Important: make a note of the mental chatter while You are closing your positions. Which side wins: fear with “close it all, You don’t know what tomorrow is made off” or greed “just one lot, and leave everything on the table, that’s the way to get rich”. This mental chatter is an important window into your psychological market make-up. Journal your thoughts and emotions, You will find treasures

Ride

“Everybody’s got a plan until they get punched in the teeth”, ​Mike T​yson Mysteries

Now that all the hatches are closed, that i am safe and sound in the cockpit, time to find this bottle of stiff spirit and roll with the storm. The only permissible trades are Longs: close poor performers during squeezes and buy resilient stocks as they underperform.

The hard part is to accept to let go of your paper profits. You have to accept that short squeezes will come and go, that they will wreck your portfolio and that You will have to watch it happening and keep calm. This is part of the game. Roll with the punches.

Important: Journal your fears. There is a tremendous wealth of information here. This is an exceptional opportunity to learn about what makes You tick.

Reload

“it is not about how about hard You can punch, It is about how hard You can get punched and keep coming back”, Rocky Balboa

The whole purpose of the method is to go past the squeeze and reload. Alright, i got humbled, but i am still standing and now it is my turn to hit back. In the above chart, the positions with long green bars have gone through multiple stages of reduce/reload. Australia, Junk bonds, oil, natural gas and Jim O’Neil’s BRICs have delivered over time.

Once the squeeze is over and stocks start to roll over again, it is time to:

  1. Reset the stop losses lower: swing high + n * ATR
  2. Reload existing positions
  3. Reallocate resources to new promising shorts

Example: SPY was entered at 202. It represented -3.8% of the portfolio. Only 0.8% was necessary to cover so as to ensure break even on the remainder position. Previous stop loss was at 209.92. Current stop loss is at 201.23, below cost. This gives +0.15% of positive risk carry to be deployed to another tranche of SPY.

​Short-selling is not like Long buying: You cannot buy once and throw away the key. Shorts shrink, so You have to keep topping them up. Every time a stop loss is lowered, residual risk decreases. This goes far beyond eliminating risk. Positions continue to accumulate positive carry along the trend. This gives a distribution like the chart below where best performers have 5:1 reward to risk.

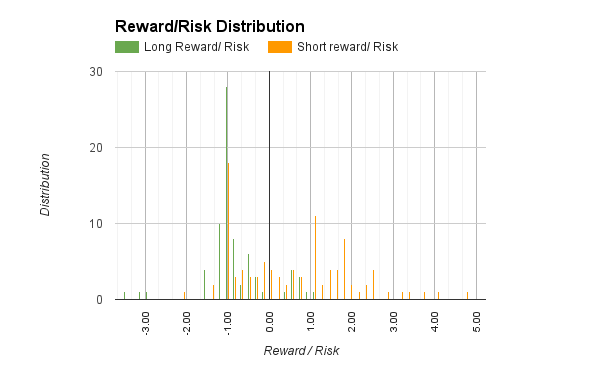
The -1 peak stands for positions being stopped out. Failure is the primary ingredient of success.

-2 and below positions are positions that woke up way below their stop losses. EWM was a good case in point: i closed a Short, open a Long and a week later the position lost 30% overnight. Volatility was high, so size was small anyhow. It was unpleasant but not hurtful.

As You can see, the methodology is simple: reduce risk, ride the storm and reload. Yet time and again, i have failed to execute and in the beginning at least so will You. Now, would You like to know why ?

Marshmallows, or why i used to fail to execute a simple methodology as the triple R

90% of trading is mental, the other half is just good maths. The triple R methodology relies on three principles

  1. Commitment: this methodology only works if i am committed to hold your positions long term. If i just want quick gratification, i will take profit too early and never allow them to fully mature. Similarly, i would never have the stamina to be slapped around so much
  2. Clear trading plan: commitment is directly proportional to the clarity of the trading plan. People don’t fail because they don’t have a plan. They stumble because they have complex ambiguous ones.
  3. Mental reframing: We are hardwired to do the exact opposite of the triple R​Loss aversion: Kahneman Tsversky have demonstrated that we are risk adverse with profits and risk seeking with losses (i am writing an awesome must-read & practical post about this + Jungian archetypes and neuro-chemistry BTW, so stay tuned)Process versus outcome: performance is the outcome of a good process. ​​delayed gratification: the single predictor of success in life is whether You will eat the marshmallow. Behind the adorable cruelty there is a profound principle Faith: it is simply the perseverance to trust and execute a plan. In the Jungian archetypes, those are the resilience of the orphan combined with the vision of the magician and the discipline of the ruler

Beyond the fascinating academic research on the brain, i came to find a simple conclusion. The reason why i failed was poor habits. As soon as i became conscious of my habits, i became able to fashion new ones. A simple habit is to reset stop loss. Another is to take profit at the onset of a rally. A third one is strict position sizing. All those habits have fashioned my investing style.

So, when the short squeeze was upon us, it was not hard to step aside and let it pass, however petulant it could be. It is a habit now.

Conclusion

“if You can meet triumph and disaster, And treat those impostors just the same”, Rudyard Kipling

The short side is the Antarctica of the markets. It is out there, not too far from civilization, but vastly unexplored at the same time. My stance on short selling is simple: if You think a stock is short, don’t fool people with writing a book about companies fooling people, don’t talk your book to Bloomberg reporters, don’t sue companies. Just locate some borrow, place the trade and let the market give its verdict. Those are no market wizards strategies, those are marketing wizard gimmicks.

Being a good short seller requires a lot of humility. A short squeeze is always around the corner. It takes a lot of strength to forego instant gratification for the sake of long term rewards. So, when the month ended at +0.59% instead of +5.9%, did i feel bad ? Of course, it hurt, but then: Mr Short Squeeze, is that all You got ? Now, my turn…


Track record 2015 – 05 – 22

Nothing speaks louder than a track record. There is no shortage of interesting indicators, strategies, ideas, but in the end, we trust only one thing: track-record. Track record sheds a crude light over two things: robustness of the strategy and quality of execution. Here are the things I have committed to:
  • run this strategy live with real money: 3/4 of my life savings
  • publish the track record on our website
Week in review: May 22nd
Attached is a pdf of the track record:  Track Record 2015 – 05 – 22
Forex impact:
Cash deposits are held in Euro, GBP and JPY. Base currency is denominated in USD. Converting everything into USD would eliminate the currency risk. Forex is however one more tool in the toolbox. EUR and GBP trends have turned bullish against USD. This may juice up NAV growth. This week, it detracted -0.6% from performance.
Performance analysis:
Performance excluding Forex impact was +1.01% inception and month to date. It was +0.48% YTD, inclusive of Forex impact. Both Long and Short books have contributed. Portfolio is still in ramp-up phase. No open position has been either reduced or closed yet. Hit ratio is 32% and 67% on the Long and Short sides, respectively.
Risk:
Cumulative risk is -6.69% to the equity. Risk-per-trade remain below budget (-0.68%) at -0.24% and -0.3% on the Long and Short side, respectively.
Customised metrics measure risk. Sharpe, Sortino, Treynor are the right mathematical answers to the wrong question: volatility is not the enemy. Formulas of the Common Sense ratio, amygdala index and other risk measures will be disclosed in ulterior articles.
Exposures
Net exposure is +60%. Directionality is intentional. Correlation between ETFs is low. For example, correlation between uranium long and Dow Jones Transportation short is low. If securities were correlated, i-e constituents of an index, then relative instead of absolute series would be traded. This would collapse the net exposure to +/-20%.
Signals are taken as they appear. The vast majority of signals are longs for now. Short signals with expensive borrow (>5% ) are rejected.
Gross exposure is now +138%. It will rise as long as the quality of performance (measured by the amygdala index) warrants it. The amygdala index is an asynchronous version of the ulcer index.
Productivity
 A time-sheet keeps precise record of time and activities. This week, it took 2 hours 49 minutes to reconcile trades, process signals and trade. Friction can be further reduced.
Time invested to build the file is not recorded (approximately 29 hours 38 minutes), as it will be amortised over the lifetime of the spreadsheet.
Strategy synopsis
This strategy was developed on the short side in order to underperform the longest bear market in modern history: Japan equities. It follows a philosophy of essential simplicity: complexity is a form of laziness.
The strategy is composed of two modules: entry/exit signals and money management.
Signal Module
Entry and re-Entry conditions are simple. It is easy to get in, but hard to stay in. Entry is a choice, exit is a necessity
  1. Regime definition for all constituents in the universe
    1. Bullish: higher highs & higher lows
    2. Bearish: lower lows & lower highs
  2. Entry: “Buy on Weakness” (Bullish Weakness) and “Short on Strength” (Bearish Strength)
    1. Long: enter the day after a swing low has been recorded && dominant trend remains bullish, “Bullish weakness”
    2. Short: enter the day after a swing high has been recorded && dominant trend remains bearish, “Bearish Strength”
  3. Exits: There are three types of exits:
    1. Isometric staircase stop loss: all open positions are simultaneously closed. Stop Loss is calculated as the swing value +/- an allowance for volatility in Average True Range (ATR).
    2. Trend reversal: if a trend reverses from bullish to bearish, all Long open positions are closed. This is the highest possible point at which positions can be logically closed. Symmetrical rules apply on the short side when a trend reverses from bearish to bullish
    3. Risk reduction: our primary concern is risk. Every new position adds risk. So, the priority is to reduce. We have developed a proprietary adaptive exit threshold (AET) algorithm that optimizes the quantity to be closed, while reducing risk to near zero level
  4. Re-Entry: re-entries are allowed only after a partial exit has taken place. Re-entries are only possible along the trend
  5. Stock selection and order priority:
    1. Signals: every day, signals on ETFs, Forex and major indices are published on our website. Candidates come exclusively from that list. The exact same information is available to everyone, including myself.
    2. Priority: Candidates are ranked by position size: the bigger, the better. Borrow check happens before position sizing. Thin expensive borrow is an indication of how crowded trades are. All trades with borrowing fee above 5% are rejected. This is the only difference between Longs & Shorts.
Money Management
Money is made in the money management module. Risk is not an abstract debate over an investment thesis. Risk is a series of numbers, made visual so as to stay painfully compelling at all times. Our basic philosophy is: profits look big only to the extent that losses are kept small. Tomorrow’s reward cannot be predicted, but risk can be managed today. Our Alpha Secure proprietary position sizing algorithm responsively manages risk (per trade and in aggregate), exposures (Gross/Net), position sizes in real time.
  1. Alpha Secure: This proprietary position sizing algorithm is so impressive that the company was named after it. This tool weathers drawdowns and re-accelerate during winning streaks.
  2. Net exposure:
    • This is an absolute directional Long and Short model: both sides are expected to generate alpha. Directionality (Net +/-100%) is only tolerated because of the low correlation between constituents (ETFs). If the universe was composed of stocks within a index, we would run relative series and collapse net exposure to +/- 20%
    • Net exposure is a direct function of signal generation. For now, the vast majority of signals are bullish. I woke up -100% net short every day for 8 years. So, net exposure will go deeply net negative when needed.
  3. Gross exposure: Gross exposure will be limited to less than 400% so as to avoid margin calls. Gross exposure is a function of market’s money and the Alpha Secure algorithm
  4. Cash deposits: Cash is maintained in various currencies. Forex is another tool in the toolbox to increase equity
Objectives
When managers say “I want to make as much money as possible”, it usually means “I have no risk-control in place”. Expressing objectives in terms of absolute performance percentage points falls into the outcome bias trap. This is a process driven portfolio. Accordingly, objectives are expressed in risk metrics
  1. Reward to risk ratio above 3 for risk management
  2. Common Sense Ratio between 1.8 to 2.1 for robustness
  3. System will be deemed bankrupt if maximum drawdown reaches -20%.
Chart examples:
Charts published every day contain the same information as the ones traded, but presented in a different fashion.

The first chart shows over-imposition of the Buy/Sell strategy over the public chart. They contain rigorously the same information. The only difference is the order logic component, absent in the public display chart, so as not to constitute a Buy/Sell strategy.
  • Stop Loss is the dotted line below each swing Low
  • Numbers preceded by the # sign (for example:#7.6%) are a rudimentary position sizing algorithm that assumes -1% loss to the equity if a position was entered at the Close of the day when the signal happens and stopped at the lower dotted line on the Long side (upper dotted line on the short side)
  • The upper dotted line is a level at which closing half (50%) the position would ensure the trade breaks even thereafter
Black triangles symbolise entries. Stacked black triangles represent single entry but multiple/split exits
Red/Green inverted triangles symbolise exits. Stacked triangles represent final exits. In the example above, the four triangles show the final exit of 4 open positions. Trend reversed from bullish to bearish.
 This is the public version of the same chart. Numbers are rigorously the same. Any smart trader can figure out for herself. In fact, the public version has the advantage of giving free will back to traders. It leads itself to multiple permutations, free from the “mechanical” constraint of a systematic strategy. For example, sideways periods can be used to accumulate stocks, or stay out of the markets.
Below are examples on the short side, with both the “weaponized” and public versions of the same chart. Strategy is symmetrical. It was developed on the short side and then translated to the Long side.
 
The key to being successful on the short side is to take risk off the table. and top-up successful positions. This is exactly what this strategy does.
Charts stripped of Buy/Sell signals lend themselves to multiple combinations and permutations. For example, the three low dotted lines indicated a volatility adjusted inverse head and shoulder pattern: volatility abated and as a result, stop loss moved higher, a movement that preceded a trend reversal.
Call to action
Please opt-in on our website. You will receive daily/weekly signals on equity indices, ETFs and Forex. The same signals on ETFs go into the portfolio.
You will also receive research on money management, trading strategies and trading psychology.
In addition, You will receive codes on C#, free Excel files. Those tools and utilities are not available to non-subscribers.
http://alphasecurecapital.com/subscribe/


Track record ETF portfolio 2015 – 05 – 15

Nothing speaks louder than a track record. There is no shortage of interesting indicators, strategies, ideas, but in the end, we trust only one thing: track-record. Track record sheds a crude light over two things: robustness of the strategy and quality of execution.
In 2013 and 2014, I wanted to start a hedge fund out of this strategy. We gathered some interest, but we were not able to raise enough assets to make it a viable commercial proposition. Reason was simple: live track-record. The strategy had been running on paper for years, (my bonus was calculated out of it so it was serious), but my employer back then had no interest in seeding a product that would be radically different from their product line-up. Being a sushi chef in a steakhouse does not have a bright long term career prospect.
So, here are three things I have committed to, I will:
  • run this strategy live with real money
  • put 3/4 of my life savings in it
  • publish the track record on our website
Track record for the week-ended May 15th
Attached is a pdf of the track record. The portfolio is still in ramp-up phase. Large positive net exposure is due to the abundance of bullish signals across the investment universe.
Borrow can be thin and fairly expensive for some ETFs. As a results, 3 short candidates were rejected. Borrow ranged from 6% to 9%.
Strategy synopsis
This strategy was developed on the short side, in order to underperform the longest bear market in modern history: Japan equities. This is why it has many counterintuitive features that make sense in aggregate. It relies on three assumptions: persistence of trend, risk management, capital efficiency. If trends persist, then temporary weaknesses/strengths constitute high probability entry points on the Long and Short sides, respectively. It also means that as probabilities recede, risk increases. It is therefore prudent to reduce risk, as trades mature. Capital efficiency simply states that compounded resources put back in circulation should be consistently re-allocated to fresh positions. We assume we cannot predict the future and do not know which trades will be big winners, so we keep on fishing.
The strategy is composed of two modules: entry/exit signals and money management. It takes a bit of grit (> 3,762 hours) to simplify every element to its bare essence. The objective is to continuously invest in successful trends, while reducing risk along the way.
Signal Module
Entry and re-Entry conditions are simple. It is easy to get in, but hard to stay in. Exits, on the other hand, took hundreds of hours for a simple reason: the quality of exits determines the shape of the P&L distribution. Entry is a choice, exit is a necessity. The exit process has been simplified from 9 layers to 3.
  1. Regime definition for all constituents in the universe
    1. Bullish: higher highs & higher lows
    2. Bearish: lower lows & lower highs
  2. Entry: “Buy on Weakness” (Bullish Weakness) and “Short on Strength” (Bearish Strength)
    1. Long: enter the day after a swing low has been recorded && dominant trend is bullish, “Bullish weakness”
    2. Short: enter the day after a swing high has been recorded && dominant trend is bearish, “Bearish Strength”
  3. Exits: There are three types of exits:
    1. Stop Loss: isometric staircase stop loss: all open positions are closed. Stop Loss is calculated as the swing value +/- an allowance for volatility expressed in Average True Range (ATR).
    2. Trend reversal: if a trend reverses from bullish to bearish, all Long open positions are closed. This is the highest possible point at which positions can be logically closed. Symmetrical rules apply on the short side when a trend reverses from bearish to bullish
    3. Risk reduction: every new position carries risk to the equity. So, the priority is o reduce risk. We have developed a proprietary adaptive exit threshold (AET) algorithm that optimizes the quantity to be closed, while reducing risk to near zero level
  4. Re-Entry: re-entries are allowed only after a partial exit has taken place. Re-entries are only possible along the trend
  5. Stock selection and order priority:
    1. Signals: every day, signals on ETFs, Forex and major indices are published on our website. Candidates come exclusively from that list. The exact same information is available to everyone, including myself.
    2. Priority: Candidates are ranked by position size: the bigger, the better. Borrow check happens before position sizing. Thin expensive borrow is an indication of how crowded trades are. All trades with borrowing fee above 5% are rejected. This is the only difference between Longs & Shorts.
Money Management
Money is made in the money management module. Risk is an obsession. Risk is not an abstract debate over a thesis. Risk is a series of numbers, made visual so as to stay painfully compelling at all times. Our basic philosophy is: profits look big only to the extent that losses are kept small. Tomorrow’s reward cannot be predicted, but risk can be managed today. Our proprietary position sizing algorithm responsively manages risk (per trade and in aggregate), exposures, position sizes in real time.
  1. Alpha Secure: This proprietary position sizing algorithm is so impressive that the company was named after it. This is the best tool to weather drawdowns and re-accelerate during winning streaks.
  2. Net exposure:
    1. This is an absolute directional Long and Short model: both sides are expected to generate alpha. Directionality (+/-100%) is only tolerated because of the low correlation between constituents (ETFs). If the universe was composed of stocks within a index, we would run relative series and collapse net exposure to +/- 20%
    2. Net exposure is a direct function of signal generation. For now, the vast majority of signals are bullish. I woke up -100% net short every day for 8 years. So, net exposure will go deeply net negative when needed.
  3. Gross exposure: Gross exposure will be limited to less than 400% so as to avoid margin calls. Gross exposure is a function of market’s money and the Alpha Secure algorithm
  4. Cash deposits: Cash is maintained in various currencies. Forex is another tool in the toolbox to increase equity
Objectives
When managers say “I want to make as much money as possible”, it usually means “I have no risk-control in place”. Expressing objectives in terms of absolute performance percentage points fall into the outcome bias trap. This is a process driven portfolio. Accordingly, objectives are expressed in process metrics. Those are a) reward to risk above 3 for risk management, b) Common Sense Ratio between 1.8 to 2.1 for robustness, 3) trading edge of 0.5 to 1.5 for quality of performance. System will be considered bankrupt if maximum drawdown reaches -20%.
Chart examples:
Charts published every day contain the same information as the ones traded, but presented in a different fashion.

The first chart shows over-imposition of the Buy/Sell strategy over the public chart. They contain rigorously the same information. The only difference is the order logic component, absent in the public display chart, so as not to constitute a Buy/Sell strategy.
  • Stop Loss is the dotted line below each swing Low
  • Numbers preceded by the # sign (for example:#7.6%) are a rudimentary position sizing algorithm that assumes -1% loss to the equity if a position was entered at the Close of the day when the signal happens and stopped at the lower dotted line on the Long side (upper dotted line on the short side)
  • The upper dotted line is a level at which closing half (50%) the position would ensure the trade breaks even thereafter
Black triangles symbolise entries. Stacked black triangles represent single entry but multiple/split exits
Red/Green inverted triangles symbolise exits. Stacked triangles represent final exits. In the example above, the four triangles show the final exit of 4 open positions. Trend reversed from bullish to bearish.
 This is the public version of the same chart. Numbers are rigorously the same. Any smart trader can figure out for herself. In fact, the public version has the advantage of giving free will back to traders. It leads itself to multiple permutations, free from the “mechanical” constraint of a systematic strategy. For example, sideways periods can be used to accumulate stocks, or stay out of the markets.
Below are examples on the short side, with both the “weaponized” and public versions of the same chart. Strategy is symmetrical. It was developed on the short side and then translated to the Long side.
 
The key to being successful on the short side is to take risk off the table. and top-up successful positions. This is exactly what this strategy does.
Charts stripped of Buy/Sell signals lend themselves to multiple combinations and permutations. For example, the three low dotted lines indicated a volatility adjusted inverse head and shoulder pattern: volatility abated and as a result, stop loss moved higher, a movement that preceded a trend reversal.