Posts

When running multiple strategies, should position size be changed based on the drawdown of individual positions, systems or the system as a whole?

This question was originally posted on Quora. Something really cool dawned upon my drunken stupor lately and i modified a chapter in the book. By group of systems, let’s assume you refer to strategies.

One-size-fits-all position size algo is a form of laziness

Most people have a one-size-fits-all position sizing algorithm across all their strategies for the long and short side, through drawdown and run-ups. That is as efficient driving the same car in the same gear uphill, downhill, downtown or on the highway.

Two possible explanations for that:

  1. hmm, never really thought of that
  2. you gotta soldier on through the skinny days to reap the fat days.

Money is made in the money management module

How you bet determines how much you make. Over a small data sample, stock picking might make a difference. Over a complete cycle where style goes in and out of favor, position sizing is the main driver of performance.

Now, let’s reframe the question: Should position sizing depend on the equity curve, the strategy, the side (Long/short) and/or the individual security traded?The answer is all of the above.

The position size that you are about to take should reflect:

  1. how well you are doing at the moment in general: The idea is to take more risk in run-ups and less during drawdowns
  2. the strategy you are about to trade: Different strategies warrant different position sizing algos or at least different values for the variables. Example: high win rate mean reversion and low win rate trend following etc
  3. the side you are trading on: long or short, they have different win rates and expected pay-offs
  4. the instrument: let’s say you got 3 false positives in a row, you might want to take less risk. This is an individual penalty ledger. Conversely, if you ladder in or scale up, you might want to depreciate risk for any additional position

Putting everything together

This gives a pyramid like this

Now, the first layer is the risk adjusted account balance. I will not go into details on how you calculate this, but in practice either your equity curve or your account balance would do.

Drawdown module

Then, You want to stick a drawdown module, that would reduce the capital allocated based on your current balance versus the peak. Simply said, if You are in a -5% drawdown, you might want to allocate only 50% of the capital you would normally allocate. This drawdown module has a shape like this:

For reference, the black line is what Millennium Partners does to managers: they reduce the book by half after a -5% loss. The green line is a conventional arithmetic proportional reduction. The red is my own take on this concept. Formula is proprietary

Strategy and side stats:

This means you need to keep a record of the stats for each position sizing algo you use for each strategy on each side. This is still at the portfolio level. Example: let’s say currently trend following has 40% win rate on the long side and 20% on the short side. Mean reversion has 60% Long and 30% short etc.

This tells you which strategy works on which side etc.

Now, let’s move down to the individual instrument level

Penalty ledger and game theory

Now, this is where things get really interesting. Some market participants like to use game theory for stock selection. I believe game theory is better suited for position sizing.

The difference is: using game theory for entries is a binary choice: either in or not in. There is no learning there because you do not keep stats on the choices you did not make. Unless you are a creepy stalker, you do not keep tabs on the women you did not marry…

At the security level, you have stats over how well each position has performed. Reward those that did well and punish those that did not is a simple elegant heuristic. This is where game theory really works well. The algo we use is a child playground game, worked for centuries. It has consistently defeated sophisticated game theory algos in iterative contests. You want to know which algo it is, go pick up your kids a bit earlier today.

Pyramid depreciation

Adding tranches to an existing position is called scaling in/laddering/pyramiding. This is a staple for trend followers. Now, trends are born, grow, mature and eventually die, a bit like believers in the Efficient Market Hypothesis. So, you need to depreciate risk as you add new tranches. A simple way to do this is:

depreciation rate = 1/(1+n),  with n=0 before you enter your first position

Now, multiplication has this wonderful property called transitivity, that allows us to blend everything together in a condensed formula that looks like this:

Size = Capital * drawdown module * penalty ledger * depreciation * f(strategy stats, side stats)

Trade rejection, asset allocation, and regime change

And the best for last. Once you grind your variables through the above formula, out comes a position size. then, you want to have a trade rejection hurdle. Below x% or x(MV) position size, trade is rejected.

What it says is simple. One of the ingredients in your basket is rotten:

It could be either: 1) you are in a drawdown, 2) the strategy that is out of favour now, 3) the side is not working, 4) the instrument itself has a frustratingly low win rate, 5) You have already reloaded a few times. Whatever the reason, this is not a fat pitch, so you want to keep your powder dry.

This has implications on asset allocation and regime change. Let’s say you run a multi-strat book. Your amount of capital is finite. So every position has to compete for cash.

By systematically weeding out the ones with low score, you end up privileging the strategy that works the best under the current regime. This means you would take a lot of mean reversion trades in a sideways market, while the trending algo would suck air. Then, as Ms. market feels like trending, your trending positions would lift the overall trending strategy stats and get a better allocation. Now let’s say the trend would be down, your long trending stats would deteriorate and the algo would be naturally more selective.

Conclusion

Position sizing is a vastly under-appreciated topic, despite being the primary driver of long-term returns: it is not what you pick that makes the difference, it is how big you size them. Position sizing can achieve much more than just delivering returns.

Some of the thorniest issues for multi-strat managers are asset allocation and regime change. Well, your position sizing algo can do the heavy lifting for you to allocate between strategies and navigate regime change.

For more on the topic of position sizing, check this blogpost on Quora: Simplified-Convex-Position-Sizing-Something-Your-brain-can-trade-Part-II


#Quora: How should I manage a client’s portfolio if he wants a 8-10% return and no negative years worse than -5%, and has a starting amount of $2…

How should I manage a client’s portfolio if he wants a 8-10% return and no negative years worse t… by Laurent Bernut

Answer by Laurent Bernut:

Experience has taught me that people like this are a plague. They are not risk adverse. They are conservative to the point of being risk seeking: by refusing to accept moderate waves of volatility, they invite left tails tsunami. If You cannot afford to turn his money away however, here are the formulas

A. Psychology of conservative people

If You can’t stand losing, then You shouldn’t play. When they say they are willing to accept modest returns as long as You don’t lose much, what they mean is they do not want to lose at all.

Conservative is not synonymous with risk adverse. They are opposite in fact. Risk adverse means You have articulated and pieter_bruegel_the_elder_-_the_parable_of_the_blind_leading_the_blind_detail_-_wga3512quantified your risk appetite. Conservative means You are afraid of taking any risk. You are ready to discount your ambitions to the point they will be met with certainty. Kodak, Nokia were risk adverse…

It also means they are afraid and think everything is risky. It is your responsibility to educate them on risk. Do not step into dissertation mode about China, the Fed, Venusians landing in Central Park and Yoyogi park in Tokyo (i will sacrifice myself and volunteer if those sexy Venusians want to perform tests on my body). Risk is not a story, risk is a number.

Secondly, if You deliver, they are likely to demand more over time: 8–10% turns to 10–12% etc. Two reasons for this: you will be put in competition with other managers who promise they can deliver better with the same risk. Since your returns are underwhelming, You will be in constant competition. Secondly, and this is more insidious, they become overconfident. Since they believed everything was risky but now are making money, and they still don’t understand risk, they turn euphoric, literally drunk on testosterone and dopamine. They are laughing their way to the bank until the day you start losing again.

B. Market’s money

The strategy is to start small with minimum risk and increase gradually as you generate performance. Then, before year end, you reduce risk so as to start the new year afresh.

Many people do the gradual increase well, but forget about the decrease. Investors think in calendar years.

Example: first quarter, you generated 2%. You can now increase risk by x% of your gains (10–33%). So instead of risking 0.10% per trade, you would risk, 0.12% and so on and so forth.

Comes November, You are currently risking 0.20% per trade. Now, it is time to de-risk down gradually down to 0.10% so as to start January with a low risk, low concentration portfolio, ready for the new year. Remember: in the investors mind, January is the beginning of a new year, not the continuation of last year’s market.

C. Risk:“how much is enough?”, Steven Seagal, obese mythomaniac

You will often read that you should not risk more than 1–2% of your capital per trade. This does not mean position size, but equity at equity at risk. In your case, if you apply that rule over 5 stocks, one bad month and game over for good. So, get a better bad idea …

What is the maximum risk You can afford on each trade? This is one of the thorniest questions in financeI have pondered that question for years, until one day i came up with a simple elegant solution. Input variables

  1. Drawdown tolerance: If Your investor redeems, game over. he said he would tolerate -5% max drawdown. So, in order to be safe, you should probably calibrate your risk to a fraction of this. If You calibrate at 100%, he will redeem and this is one time where being right is bad, very bad. Besides, you need to rebound from drawdown, so let’s say somewhere between 50%-66.67%, say 2/3
  2. Avg number of positions: over 1 turnover cycle, what is your average number of positions? let’s say: 50
  3. Loss rate: over 1 turnover cycle, what is your average loss rate. In case You don’t know use 60% as loss rate (Yes, it means you lose more often than win, and it is called prudence)

Equipped with this:

Max risk per trade = Drawdown tolerance / (Loss rate * Avg #positions)

= 5% * 2/3 / [50* 60%]

Max risk per trade = 0.11%

Now, that was the max risk per trade. Let’s move to the min risk per trade. This is a fraction of that: usually 40%. So, your min risk per trade would be around 0.05%

Add trading has a cost: 0.036% blended avg, between DMA and high touch at Credit Suisse for example (as a good friend complained again this morning while we were naked in the gym shower !?!).

Now, You probably start to understand why i mean that those customers are toxic. When You go through a drawdown and you will have rough periods, You will simply not be able to dig yourself out.

Conclusion

Once in early 2013, i was cruising at a hedge fund party nursing some nasty Chardonnay and some dude who just launched was explaining his strategy:

-“fundamentals pairs trading”, he proudly said

-“So, You must be Long Toyota and Short Mazda, right? Mazda has gone up 400% and Toyota 30%. That must be a painful trade? ”, i asked

-”Nah, positions are small anyways, so no it does not hurt”, he confidently replied

-”Well, if they are too small to hurt, do You think they are big enough to contribute?”, i candidly asked

And he did the unthinkable rudest thing someone can do in Japan. He gave me back my business card and walked away

How should I manage a client’s portfolio if he wants a 8-10% return and no negative years worse than -5%, and has a starting amount of $2…

#Quora: How does one address the issue of regime shift in algorithmic trading?

How does one address the issue of regime shift in algorithmic trading? by Laurent Bernut

Answer by Laurent Bernut:change-of-season

Fascinating topic that has kept me awake for years. It is a thorny issue. As the patent clerk Einstein used to say: answer are not at the same level as questions. Answer is not at the signal (entry/exit) level. These are position sizing and order management issues.

Definition of regime change

Everybody has a savant definition, so i might as well come up with a simple practical metaphor. imagine You drive at 150 km/h on the highway and then all of sudden, this 4 lanes turns into a country road. If You do not react quick, you will go tree-hugging.

There are three market types: bull, bear and more importantly sideways. Each type can be subdivided into quiet or choppy. So, we have six sextants. Regime change is when market moves from one box to another.

It can be either a new volatility regime, or a move from bear to sideways, sideways to bull or vice versa. Markets rarely move from bull to bear. There is some battle between good and evil.

Why it matters?

Many strategies are designed to do well in a particular environment. They make a lot of money that they end up giving back when regime changes. Examples:

  1. Short Gamma OTM: sell OTM options and collect premium. Pick pennies in front of a steam roller. 2008–2009, August 2015, CHF depeg, Brexit etc. 1 day those options will go in the money and game over
  2. Dual momentum: trade the shorter time frame but determine regime on longer time frame. When market hits a sideways period, market participants get clobbered on false breakouts like poor cute little baby seals
  3. Mean reversion: works wonders in sideways markets until it does not. An extreme version of that is Short Gamma
  4. Value to growth and vice versa: that is probably the most lagging one. By the time, my value colleagues had thrown the towel and loaded up on growthy stocks, market usually gave signs of fatigue…
  5. Fundamentals pairs trading: relationships are stable until market rotation. For instance, speculative stocks rally hard in the early stage of a bull market, while quality trails. Example: Oct-Dec 2012, Mazda went up +400% while Toyota rallied +30%

The vast majority of market participants are trend followers, whether it is news flow, earning momentum, technical analysis. Trending bulls they do great, trending bears, they can survive. Sideways is where they lose their shirts on false positives.

The issue often boils down to how to enter a sideways regime without losing your shirt

The value of backtests

I agree that backtests will help you identify when your strategy does not work. This is actually the real value of backtest. This is when you modify the strategy and adapt the position sizing to weather unsavoury regimes. Then trade this version, not the ideal fair weather strategy.

Reason is simple: everybody’s got a plan until they get punched in the teeth. So don’t lower your guard, ever.

Asset allocation across multi-strats

Some market participants like to develop specific strategies for specific markets: sideways volatile, awesome for pairs trading, great for options strangle/straddle short. Breakouts are good for trending markets etc.

How do You switch from one to the next ? Fixed asset allocation is as clunky, as primitive and as MPT as it gets. There is something far more elegant and simple:

  1. Calculate trading edge for each sub-strategy: long Trend Following, pairs etc
  2. pro-rate trading edge for each strategy
  3. Allocate by pro-rata
  4. Allocate a residual minimum even to the negative trading edge strategies

This is a simple way to put money where it works best

Regime change for single strategy

When not to trade

Van Tharp believes that there is no strategy that can do well or at least to weather all market conditions. I believe there is more nuance. Is the objective to make money across all market regimes? For example, sideways quiet are preludes to explosive movements. In order to make any money, you need to trade big and if you are on the wrong side when things kick off, game over

We trade a single unified (mean reversion within trend following) strategy. What follows is our journey through solving the regime change issue. We found that the three best ways to manage regime changes are

  1. Stop Loss:
  2. position sizing:
  3. order management:

Stop Loss

Regime changes are usually accompanied with rise in volatility. Volatility is not risk, volatility is uncertainty #de-friendSharpeRatio

We used to have a complex stop loss rule. Now we have a uniform elegant stop loss. It just lags current position. It is fashionably late, hence its name: French Stop Loss.

The idea there is to give enough breathing room to the markets to absorb changes without giving back too much profit.

Our solution is to consider stop loss as a fail safe and allow the market to switch direction bull to bear and vice versa within the confine of a stop loss.

The result is we end up switching from one regime to the next more fluidly. We have reduced the number of stop losses by 2/3, which in turn has materially increased our expectancy.

Stop losses are costly. They are the maximum you can lose out of any position.So, unless you have a kick ass win rate or extremely long right tail, you want to reduce their frequency and allow the market to transition.

Position sizing

The first thing You need to understand is that You cannot predict/anticipate a regime forecast. You will find out after the facts. This has some immediate consequences on position sizing: always cap your portfolio risk

Many position sizing algorithms use equity in layers or staircase. We base our calculation of peak equity. So, drawdowns however small have an immediate impact on position sizing. This slams the break much faster than any other method i know.

The other side of the equation is risk per trade wich oscillates between min and max risk. When regime becomes favourable again, it accelerates rapidly.

The whole premise is early response to change in regime through position sizing

Another feature is trend maturity. Betting the same -1% at the beginning and at the end of a trend is asking for a serious kick in the money maker. Trends are born, grow, mature, get old and eventually die one day, just like believers in Efficient Market Theory. So, risk less as you pyramid.

Order management and hibernation

Along with the position sizing comes a vastly underrated feature in most order management: trade rejection.

Secondly, we use a position size threshold. When markets get too volatile and we experience some drawdown, stop losses dilate. As a result, position sizes get smaller. When sizes are too small, trades get rejected.

Order management is vastly under-utilised in most systems i have seen. It is often binary, all-in/all-out, or one way scale in or scale out.

In our system, taking profit off the table is a not a function of chart, technical analysis but driven by risk management. Until price goes a certain distance, exits are not triggered. If exits are not triggered, entries cannot be triggered either. Since volatility goes up and position sizes get smaller, the system drops into hibernation.

We have factual evidence that hibernation during an unfavourable regime is a powerful mechanism to weather regime change. It involves a lot more sophistication than muting indicators, slope flattening etc. It encompasses position sizing, order management, stop loss and to a lesser degree signals.

Conclusion

Multi-strat asset allocation based on pro-rated trading edge is the easy way to go.

Single strat across multiple market regimes means acceleration/deceleration but also hibernation. This is not an easy problem. There is one thought that kept me going through the frustration of figuring this out: “Building a system is like watch making. Time will always be off until the final cog fits in”

How does one address the issue of regime shift in algorithmic trading?

#Quora: What’s the biggest mistake that stock market investors make?

My answer to What’s the biggest mistake that stock market investors make?

Answer by Laurent Bernut:

Short answer: Absence of exit plan. The only soldiers who go to combat w/o an exit plan are Kamikaze. They don’t need one because they expect to die. Unfortunately so do a lot of market participants.082115-Tradingsecrets-01

The apparent simplicity of the answer hides sophisticated concepts that can be broken down in two part: statistical and psychological trading edge

I Statistical trading edge

A Stock picking is overrated

Most market participants believe that stock picking is the alpha and omega of alpha generation. Stock picking is merely everything that precedes entry. It excludes bet size and exit. Unfortunately, stock picking has little influence on the statistical trading edge

Trading edge = Gain Expectancy = Win% *AVG Win% – Loss% *AVg Loss%

1 Stop Loss is the most important variable in a trading system

Stop Loss has direct impact on 3 out of 4 components: Win%, Loss% (1-Win%) and Avg Loss%. Furthermore it has impact on trading frequency: the tighter the stop loss the higher the frequency and vice versa for Buy and Hope

Oops, this just proved that exit is the most important factor.

Please read further about the psychology of stop loss, even if you do not agree

2 Don’t call the race before the finish line

As can be seen, entry has some influence on Win% and Loss%, but nearly not as much as exit. The only time the amount of money that has been made/lost is known with irrefutable certainty is after exit, when open risk is closed

The corollary is that poor entry can be salvaged, poor exit can’t. If You do not have a proper exit plan, You will fail to appreciate the exit plan the market has in store for you

3 Money is made in the money management module

Secondly, Stock picking excludes bet sizing. Bet sizing is the most important determinant of performance

Here is an interesting story to prove this point. When I was at Fidelity, I was running my algo across all managers’ portfolios. My unbridled ambition was to help them trade better 0.05% at a time (multiply this 0.05% by 20 and you are in the rarefied atmosphere of outperformers).

It soon dawned upon my thickness that the same stocks were featured in in my esteemed colleagues’ portfolios. Nothing surprising there, everyone has access to the same research and there is healthy cross pollination. What was surprising was that despite low dispersion of holdings, there was high disparity of performance and volatility: despite owning the same stocks, some people were making a killing, while others were getting killed.

Conclusion: the difference that made the difference is not stock picking, it is bet sizing

4 Blow-ups and feed free-loaders

Watch your winners, but watch your losers more closely. Interesting story: i once had the opportunity to analyse multiple portfolios over many years across many managers on a trade by trade basis. The most important findings were:

  1. Winners look big to the extent that winners are kept small: If You exclude the worst three detractors, everyone would have outperformed the benchmark every year: 100% outperformance 100% of the time (before costs)
  2. Free loaders are performance killers: winners and losers are visible, so they get dealt with. The problem is to identify positions that are neither one nor the others, free loaders. They do not contribute enough to compensate for blow-ups and do not lose enough to be visible. They mobilise resources that should be deployed on productive assets. The psychological consequences is called capacity: you are at capacity when inertia sets in, when you do not want to take a trade because you think you are too big

The two issues that cause managers to underperform are directly related to Absence of EXIT policy

II Mental edge: 90% of trading is mental, the other half is good math

Optimism peaks before entry. After that, emotions kick in. The ultimate proof of this is divorce statistics…

1 Pre-mortem

Few market participants give bet sizing the importance it deserves. It is often either conviction (feel good) based or equal weight. Once they are in a position, things change. Or, more accurately, their perception change: they have either too much or too little of a stock.

The concept of pre-mortem is finally finding its way in decision making: Nobel prixe winner Daniel Kahneman, Dan Gilbert (positive psychology Penn U), Hal Hershfield (future self). The idea is to visualise the worst possible outcome and plan accordingly.

If for every trade You are about to take, you visualise a stop loss, something interesting will happen: you will size positions smaller. That is a natural reaction.

In other words, the most important question about fund management is: could i live with earning a little less than i could or could i afford to lose a lot more than i should ?

Again, the only way to grasp this is to mentally think about exit first

2 Kubler Ross: market participants grieve their way to selling

I am a professional short seller. On the short side, you make money by selling along people who liquidate their long position. You lose money by selling short crowded shorts…

There are many psychological charts about euphoria to despondency. They are all nice, adorable and lovely, but they are written from people whose perspective is to go Long. They do not understand the psychology of selling. There is one model that grasp the emotions we go through; the psychology of grief popularised by Elizabeth Kubler-Ross

The view from the short-side: how we process emotions and the market signature of the 5 stages of grief Kubler-Ross by Laurent Bernut on Alpha Secure

Market participants grieve their way into liquidating losers and are too complacent when leaving winners.

3 The psychology of stop loss

Even if You do not agree with what you have read so far, You must read the post below.

All diets w/o exception have failed: statistics show that we are all getting fat year after year. Diets address the wrong problem. They talk about what we eat, not about how we relate to what we eat. Diets are a psychological issue, not a physiological one.

Stop Losses are exactly the same. They are an identity issue, not a statistical one. The ego associates being profitable with being right. So, losing money is an attack on the ego. We rationalise, change our beliefs (Festinger and ognitive dissonace, Gazzanikas and split brain theory) rather than kick out losers.

Read this post to learn how to reframe your beliefs and execute stop losses like you brush your teeth.

The psychology of stop loss: how You can be 100% right despite 60% failed trades by Laurent Bernut on Alpha Secure

Conclusion:

Making money in the market is about having an edge. There are two types of edge: statistical and mental. The only ways to tilt your trading edge is to start with the end in mind: think about how you are going to exit before you enter

What’s the biggest mistake that stock market investors make?

Better System Trader: Questions from the audience

These are questions from the audience on the Better System Trader podcast with Andrew Swanscott. I am honored and humbled by the interest of listeners. We did not have time to cover all questions, so here are some written answers. If You have questions, please feel free to ask

Trading Psychology

From: Jim

The mind plays tricks on us, even with a successful system, as a system trader, what methods to use for the mental part of the system trading?  So meditation, journaling but how to implement them in one overall plan?

EXCELLENT QUESTION: Part 2 of the book will focus on this

  1. You cannot trust your mind. Michael Gazzanikas 1964 split brain theory. Self-deception: (Daniel Goleman) is a built-in feature. It happens automatically and covers its own tracks and designed to deceive us.
  2. Accountability: simple exercise to test validity of prediction and convince us we are unable to predict.
  3. Reframe from outcome to process: develop a system, account for signals generation and be honest about signal execution
  4. Daily market journal: write what You think markets, thoughts, things that happen, small comments, ideas, formulas. Do the James Altucher method: keep a moleskin with You at all times. Deliberate practice: activates the Default Modal Network (Olivia Fox Cabane)
  5. Write about the thoughts that cross your mind:
    1. dreams and aspirations when making money, why You keep doing that, why You like it. How does it manifest in the body
    2. fears, pains, detail, reflexes (ex: read the press, look for expert opinions): be specific and commit to writing or dictating. Very important
  6. Walk through your fears: meditate and manifest your fears. Seneca was history’s first investment banker. He also happened to be the founder of stoicism school of philosophy. He advocated one day a month of living frugally as a form of inoculation.

Another post on the topic:

From: @trader1970

So far as a Trader what is the biggest fear that you have not been able to overcome?  How do you manage this situation?

  • My father had a hemiplegia (brain stroke) when i was 7. He never regained motor skills and speech ability. We fell into severe poverty. As a result, I have a deep seated fear of becoming handicapped and not being able to feed my family anymore. Personal and vulnerable. Markets related fears I can deal with, I am a short seller, this is a versatile skill
  • How does it manifest itself in trading:
    1. Diversify sources of revenue: we have a real estate business that generates enough to cover our primary needs. That provides peace of mind. My family is safe from harm
    2. Frugal lifestyle
    3. Systematically take less risk: when making sizing arbitrage ask yourself, would You be satisfied with earning a little less than You could or losing a lot more than You should ?


Position sizing

From: Bass

Tell us more about risk management, Volatility based Stops and position sizing.

  • It really depends on your customers: Investors are like teenage girls: Teenage girls say they want a nice guy and they fall for bad boys. Investors say they want returns but they react to drawdowns:
    1. Magnitude: never lose than what investors are willing to tolerate
    2. Frequency: never be the last person investors think about before going to sleep
    3. Period of recovery: never test the patience of investors
  • Risk is not a story, risk is a hard number: it manifests itself in individual trade risk per trade (RPT), in aggregates exposures. Example: Long small caps / short futures is synthetically residually Long large caps as the index is primarily composed of large caps
  • Volatility stops: swings +/- 3 ATR. Volatility is as welcome as Kanye West at an award ceremony. Bad news, volatility is like Monsieur Kardashian bad manners: it is here to stay. Your job is to ride it and the way to do so is position sizing. For example, biotech and internet stocks are more volatile than department stores for example. So, size them accordingly.
  • used in position sizing. Rank trades by size (bigger first) so as to go for better volatility signature


From: Derek

Hi Laurent,

I have been following your website ASC for quite some time and also your answers on quora. I have something related to an answer you had to a quora question In investments, does more risk really equal more return, in the long haul? Your answer immediately clicked with me and it logically made sense to me. Laurent – you may want to quickly summarize what the answer was before we move on to the next part of the question. I’ll ask you what the answer was.

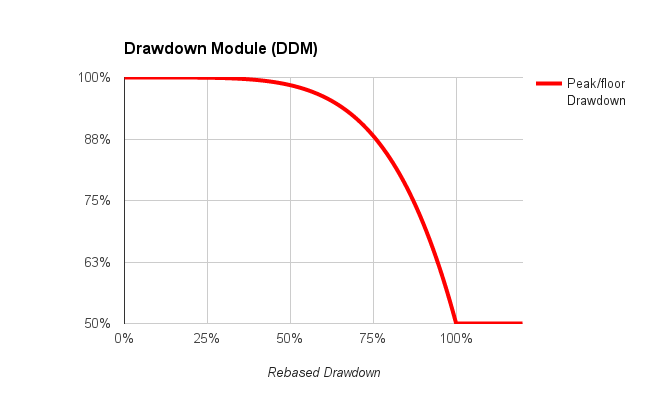
 Would you please elaborate on your convex position sizing method for a risk per trade and draw down module. This was discussed as an answer on Quora. I understand that as you make money you will allocate a larger risk budget using a convex surface with a max risk budget of -0.30. But i do not understand the reverse side of this, the draw down part.  As we get more draw down we should decrease our risk budget again using a convex surface. It starts at 100 and bottoms out at around 35. I do not understand how that part works.

 Also how did you come up with this method? Can you give a practical example of when you used this both for drawdown and additional risk scenarios?

Thank you very much

Derek

Here is a complete article on the topic. Thank You very much for asking

  1. Long Side: people add risk. Short side; frequent squeezes, start from manageable risk then reduce
  2. Metaphor of accelerator and brakes. Optimum fuel consumption happens when You do not solicit brakes. It clicked while listening to Larry Williams interview on the famous Better System Trader after bringing my daughter to the Hoikuen (crèche in Japanese)
  3. Market Value (MV) = AUM * Risk Per Trade (RPT)
  4. Most position sizing formulas will use one side RPT usually to calculate risk. In my case, this is convex so as we make money take more risk. This is accelerator. You want this to be responsive and nervous so to re-accelerate quickly after drawdown
  5. Meanwhile, when strategy stops working, You need to trade minimum risk. The problem with conventional formulas is that brakes are spongy and re-acceleration slow. You can get whipsawed. Which then erodes emotional capital, which leads to downward spiral. (Feedback loop between emotional and financial capital). By allocating a convex surface, AUM drops dramatically very quickly but then re-accelerates as there are signs of life
  6. Practical example: ETF. At the moment squeeze so drawdown, then surface immediately reacts and I naturally trade smaller. Residual open risk in my latest short entry was -0.12%, down from min risk at -0.25%

Trading Edge

From: Marcia

During your interview in episode 32 you talked about the “Edge” formula, which is, I think, ” (%wins X Average Win) – (%Losses X Average Loss) “? Would you talk more about that and what number you are looking for, or, what insights the number gives YOU?  thank you

Thank You very much. I am writing a book on short selling. Part 1 is about how to build a statistical trading edge. Part 2 is about building a mental trading edge. Part 3 is about constructing a portfolio with a positive trading edge. On the Long side, the market does the heavy lifting. On the short side, the market does not cooperate, so building a trading edge is critical

  • I am looking for positive number. I have never looked for a specific number, thank You for the suggestion
  • Use as asset allocation tool:
    • Plot trading edge by side and strategy
    • Pro-rate trading edge
    • Allocate resources (trading AUM or surface) based on trading edge, with floor and ceiling
  • This is useful for multistrats portfolios where You would systematically allocate resources to the best performing strategy

Shorting strategies

From: Adonis

What are the 3 most successful triggers he uses in going short? Does he use daily or weekly charts?

There were originally several variations on two strategies (mean reversion and trend following). Over time i have managed to merge them into one.

  1. Define trend: lower highs, lower highs
  2. Wait for roll-over: maximum information: volatility, swing high
  3. Enter on next bar

Exits:

  1. stop loss: full
  2. trend reversal (logical time exit): entry qualified on the other side happens within stop loss
  3. partial exit: risk reduction, take profit objective is to break even

Now, the delicate part is not in the signal module. Trading suspension for example is not a signal issue but a position size one. If sizes are too small, then trades are rejected. For example, sometimes currency pairs flip-flops between bull and bear. So, we count entries and add penalty for each full exit. This reduces risk per trade. If the overall equity is ain a drawdown, then position sizes get smaller. If they are too small, they are automatically rejected. This allows us to trade more pairs as some of them stop trading.


From: Graham

How do you simulate borrowing costs when testing a shorting strategy?

Everything at General Collateral (GC) +0,15% added to slippage. The question is probably related to hard to source issues or crowded shorts.

Do not short issues with borrow >5%, except on the Long side: squeeze box. Do not squeeze people: it is bad karma


From: Nikhil

1)  Majority of ideas for a short strategies seem to fail rigorous testing on larger time frames so one should focus on more active time frames [5min to 2H based data] instead of passive time frames [Daily to Monthly based data]  ?

Assumption: Nikhil may trade breakdowns, because this is a classic symptom or rebound higher than entry which leads to false positives.

Solution is not in better entry signal, but in partial exit and better money management, Trading system has 3 components: exit/entry, money management and mental.


2) Can you highlight a basic idea on a short strategies variable for further research for those struggling with constructing a short only strategy ?

JNK Short

Sure, check post on JNK attached. It is a scale-out/scale-in system.

There are 2 certainties in life: death and short squeeze. Use squeezes to your advantage

3) What opportunities do you see in the financial industry going forward for new generation of entrepreneurs (non trading/investing related) coming up ?

At the moment, everyone wants to be in the HF game. I entered the HF game in 2003 when it was still in infancy: a bunch of cowboys blowing stuff up in their kitchen. HF is bound for yet another healthy correction.

I believe the future to be threefold:

  1. Algorithmic assets allocation: fire your financial advisor. If You don’t know why, he probably does. Machines do a better job and they don’t get kickbacks…
  2. Separately managed accounts (SMA): open a brokerage account and let algo do the heavy lifting. Funds running costs are prohibitive. Besides, there is a proliferation of single brain cells parasites called compliance. They are the TSA (US airports officers) of finance: utterly useless at catching problems but extremely annoying
  3. Active management “soft patch”: SPIVA.com. The overwhelming majority of funds underperform the index and they are more expensive than ETFs. There is a gambler’s fallacy going on: ETFs have outperformed active managers so far, but the latter will be better equipped to navigate volatility and downturns. That is gambler’s fallacy: if managers failed to outperform during easy times, why would they even succeed during hard times ?

As for non-investment profession, I honestly don’t know


From: Ola

I am using market filters to keep me out of bear markets for my long only strategies for stocks, and I’m cashed up for periods of time. I find this a bit boring. What type of indicators or price action should I look for to create a short strategy to complement the long strategies? I’m looking for something simple and robust to be used on the daily time frame.

Best regards,

Ola

Check JNK trade attached. 1 Define trend, 2, enter on counter-trend move 3 exit partially as rebound comes


General trading

From: Bengt

Hello, it is often said that short trading is very difficult to make money off: Do you agree with this? If so, do you think it is a matter of the odds not being on your side or is it too much to handle mentally?

EXCELLENT QUESTION: “This is space, the environment does not cooperate… You solve one problem after another, and if You solve enough problems, You get to come home”, The Martian.

Andrew, Allow me to explain why people fail on the short side: they think from a Long perspective. This is deep shit that no-one has ever explained in statistical and psychological terms. Fascinating theme, I am writing the book on the topic and how to build a sustainable short selling practice

Example: 4 stocks: A,B Long C,D short, all start at 100

Start: Long exposure 200%, Short exposure: 200%, Gross exposure: 400% , Net exposure 0%,

A goes up by 10%, B drops by 5%. C drops by 10% and D goes up by 5%

End: Long exposure 205%, Short exposure: 195%, Gross exposure: 400% , Net exposure +10%,

Bottom line:

  1. On the long side, the market does the heavy lifting for You. There is a bigger bet on something good
  2. On the short side, the market does not cooperate: there is a bigger bet of something that does not work
  3. Net exposure is +10%. The main reason why people fail is that they want to short a throw away the key when they should be working more on the short than the long book. Just to stand still they should keep running: this is a Sherlock Versus the Red Queen effect


On the other end of the spectrum: is there an outer limit, odds-wise, for profitable long term trading, or is an 800-day breakout tougher to handle mentally than a 2 day breakout?

Best regards: Bengt

The problem is false positives: You will have many more false positives because of poor trend formation with shorter periodicity. You will deal with being systematically late. A more robust statistical approach is to deal with exits so as to move the needle from “near win” (false positive) to “near miss” (partial win)


From: Rob

Please ask for the following:

1) What works better in the forex market – momentum or mean reversion?

Mean reversion works until trend following works. It is a question of periodicity and tolerance for stop loss.

My strategy is a combination of both.

Post about two types of strategies:

2) If you had to start over from the beginning with the knowledge you have now where would you focus on and what would you throw away?

  1. Psychology: clarity about beliefs. 90% of trading is mental, the other half is good math
  2. Trading edge is not a marketing gimmick: it is a number
    1. Money management: example of convexity
    2. Exits: stop loss is the 2nd most important variable

3) You have said in the past to focus on exits and not entries – but how exactly do you do this? Is it a matter of thinking about when you will exit if you are right or wrong?

Never think about right or wrong, it is the wrong mental association that will lead to death. Think about profitable. I am writing something on the psychology of stop loss. This article is potentially the most or second most important post I have ever written.

The best analogy is diet. Diets don’t work. We are all getting fatter and there has never been as much information on diet. Diets fix the wrong thing. The problem is not what we eat. The problem is how we think about we eat. Same goes with stop loss and exit.

This is not a mathematical problem. This is a psychological issue about the meaning we ascribe to closing positions. If we associate stop loss with being wrong, the ego will revolt.

IAU option trade anecdote funny and excellent example to talk about emotional capital and Zibbibo viognier white wine blend from Etna

4) What do you think about fixed fractional position sizing

it is a good basis of any position sizing algorithm. Now, it is a bit simplistic for 2 reasons:

  1. Uniform risk taking through the cycle: think of it as a car. Sometimes it is good to accelerate, sometimes You need to decelerate. Win rate changes through the cycle and so should risk
  2. Dissociation: Long and short sides rarely work well at the same time. Since they have different win rate, they should have different risk numbers

Dissociation by side of the book, strategy using trading edge or win rate. Please check my post on convex position sizing

5) Please talk more about stops. you said in the past your stops have a large impact on your P&L – but how do you calculate your stops. What are the considerations when using a mean reversion vs momentum strategy and type of market forex vs futures.

Sure, happy to explain the equation

Now, for mean reversion strategies, the equation includes another variable: frequency. Let me give You a simple example. If you clock +0.5% per month and then have -6% month, it will take roughly a year to make that back if everything else works. So, a simple idea is to empirically come up with a patience factor. Example: never allow losses to be greater than 4 months of average profit. The difficulty though is correlation. Accidents travel in group.

Another important point on mean reversion, never trade open risk strategies. Example: short naked gamma. I was having dinner with some options portfolio managers friends. Short OTM gamma is still marketed to unsuspecting investors. Those are scams: they show consistent returns until they blow up

From: John D

I trade a long term trend following (trade every 1-3 months) system on stocks indices currencies and commodities. What type of exits would you use on this type of system?

Trailing ATR stop? Time stop? Both?

John D, You are right on all of them

Three stops:

I have developed something called box concept. Once in a trade, there are three possible scenarios:

  1. It does not work and needs to be stopped out. That is a floor or ceiling depending on whether You are Long or Short
  2. It works well and warrants some de-risking: take money off the table and leave a portion for the long right tail
  3. It goes nowhere: this immobilizes resources and needs to be dealt with

The concept is that whatever happens, it will trip one of the mines and will be dealt with. This is how it is done in practice

  1. Isometric staircase stop loss: swing +/– allowance for volatility. Markets do not go up in straight lines. They go up or down, retrace and resume their course. This method allows markets to breathe
  2. Partial trailing stop loss: take some money off the table so as to reduce risk, but leave a residual for the big trend. After taking some money off the table, it makes sense to re-enter and a add a little bit more risk.GBPJPY
  3. Time stop: buying power and trading frequency. Some stocks do not move enough to warrant either a stop loss or a risk reduction. These are the harder ones to spot. The solution is to timestamp them.

About timestamp:


Convex position sizing algorithm: something your brain can trade through euphoria and depression

Introduction

There are two position sizes: too little or too much. Too little when it is working and too much when it is not. Of course, our inner idiot compels us to take too little risk when we should be bold and vice versa when we should be prudent.

Position sizing is this critical juncture between financial and emotional capital. Deplete the former and it will take effort to rebuild. It is a complicated problem, but not a complex one. Break the latter and “Game Over”.

On the short side, position sizing is even more critical: failures get bigger and painful, while successes shrink away. Over the years, I have experimented with many position sizing algorithms. Many of them were brilliant, but I would always drift away and abandon each one of them after a while. Then, I realised I looked at the problem from the wrong angle. Convex position sizing is the story of my journey

If You have encountered “fear of pulling the trigger” or if You routinely take too much/too little risk at precisely the wrong time, then this position sizing algorithm might be for You.


Part 1: The correct mathematical answer may not be the right one

The first part of the journey was to find out why I consistently drifted from conventional algorithms.

  1. Short selling is not a stock picking contest, it is a position sizing exercise

On the short side, the market does not cooperate:

  1. Volatility is elevated: that rules out systems like equal weight.
  2. Concentrated bets is a bad idea, as their volatility drives the short book and consequently the entire book
  3. Short squeezes are frequent: expect all shorts to rally >10% over 5 trading days
  4. During bear phases, correlation goes to 1. Expect Longs and Shorts to go against You at once
  5. Unprofitable trades balloon rapidly. So, the natural tendency is to be conservative and take small risks.
  6. Unlike the long side, there are no 2-3 baggers. Winners shrink and contribute less. So, there is an opposite tendency to oversize positions.

Bottom line: the short side is less a stock picking contest than a position sizing exercise. Winners get smaller and loser get bigger. The difficulty is to size positions so that they contribute when successful, but do not torpedo performance when unsuccessful.


  1. Two types of algorithms and two types of people

There are two types of position sizing algorithms: aggressive or conservative. Risk seeking systems will have You bet beyond your comfort zone, and sometimes lose more than You should. System failure means cumulative losses have permanently damaged your ability to bounce back.

Conservative systems will have You bet small and earn less than You could. Failure means returns are not attractive enough, and/or period of recovery after a big loss is too long.

There are also two types of people when it comes to risk: risk seeking or risk adverse. Risk seeking people have higher tolerance for the volatility that comes with bold choices. If they go too far, they may no longer have the resources to bounce back.

Risk adverse people accept underwhelming returns in exchange for low volatility. Their downfall is they are sometimes conservative to the point of being risk seeking. Failure does not mean they aim too high and miss their target. Failure means they aim too low and succeed.


  1. Regime Change, transition and drift

Now, the world is not Manichean. There are times when it is wise to be conservative, settle for a risk adverse system, accept to earn a little less than You could.

There are also times when it pays off to be aggressive, ride a risk seeking system, but potentially lose a lot more than You should.

The problem is that most position sizing algorithms are good at either one or the other. They are not equipped to transition smoothly from equity growth to capital preservation. A core principle is that systems must be followed throughout a cycle in order to achieve predicted results.


  1. The correct mathematical answer may not be the right one

The problem with many position sizing algorithms is not to find the optimal size that will achieve desired geometric returns. The difficulty is keeping executing through euphoria and depression. Of course, optimal f is the correct position sizing algorithm. The problem is my inner idiot thinks he knows better.

For example, “fear of pulling the trigger” is simply the inner idiot (often referred to as amygdala) saying those bets are too big. This fear gets reinforced after every loss in the thalamus. It eventually gets to the point where the brain overrides the algorithm, but rationalises decisions. Self-deception is insidious, it covers its own tracks.

I did not abandon any of the position sizing all at once. I just gradually drifted away. I failed because my inner idiot constantly second guessed what the algorithms suggested. Discipline is futile. It’s like diet: everyone puts those kilos back on in the end.

I therefore realised that the only way to makes more sense to build a position sizing algorithm that the brain can embrace and then figure out the math.


Part 2: Convex position sizing

  1. Philosophy of the convex position sizing

Convex position sizing algorithm was conceived backward. Math is subservient to the brain. It may not be the optimal mathematical solution, but it is one my inner idiot will have no problem executing during triumph and disaster.

So, I started out with a list of demands

  1. Trade at optimum risk: (accelerator)
    1. Accelerate to maximum risk during run-ups, but
    2. Decelerate quickly as soon as there is a drawdown
  2. Absorb volatility: (brakes)
    1. allocate maximum equity, but
    2. reduce risk drastically during severe drawdowns
    3. Avoid whipsaws due to premature re-acceleration
  3. Reduce risk for each new re-entry: (trend maturity)
  4. Simple input variables (risk appetite)

The best analogy is fuel efficiency. Flooring the accelerator and then slamming the brakes is not a fuel efficient way to drive. These are aggressive systems like Kelly criterion, optimal f and Fixed Ratio Position Sizing (FRPS). Driving like Mrs Daisy is lovely, but not necessarily the most competitive style. These are systems like constant Fixed Fractional Position Sizing (FFPS), equal weight.

Convex position sizing algorithm runs at optimum acceleration. It will take on risk as equity curves rises and reduce as it comes down. It will slam the brakes to avert accidents and then re-accelerate smoothly. Risk Per Trade is the accelerator and Equity would be the brakes.

One of the strengths of the algorithm is smooth transition from risk seeking to risk adverse. The algorithm focuses on drawdowns. As soon as there is a drawdown, risk is reduced. Conventional position sizing algorithms focus on winning streaks and thresholds. They are therefore slow to react.


  1. Fixed Fractional Position Sizing revisited

Fixed Fractional Position Sizing algorithm basic formula is:

Market Value = Risk Per Trade / Distance to Stop Loss * Equity

Most formulas focus exclusively on Risk Per Trade (RPT). With the notable exception of Market’s Money, few of them consider Equity (capital allocation or surface). The idea became clear to use both sides, one for acceleration, the other for deceleration.


  1. Convex Risk Per Trade

In practice, this is what Risk per trade looks like:image (1)

Risk per trade oscillates between a minimum and maximum. Trends mature, so risk per trade is reduced for each re-entry. Convexity comes from the ratio of min/max risk. In this example, min risk is set at -0.25% and max risk at -1%. The bigger the ratio the steeper the acceleration.

How to calculate min and max risk per trade

  1. Max Risk per Trade: Risk Appetite / [AVG number of positions * (Long Term Loss Rate + 2 STDEV(Loss Rate)]
    1. Risk appetite: is not a mathematical number. It is the drawdown investors are willing to stomach before redeeming. Whatever You think that number is, divide it by 2. This is a clear case where You do not want to be right !!!
    2. Long Term Loss Rate: ideally, this is the win rate through the entire cycle. When there is not enough sample data, default to a conservative 2/3. That means 2 trades out 3 will fail. 51% Win rate is for fairy tales, and Prince charming is not coming
  2. Min Risk per Trade: this is the minimum RPT that would still allow trading during drawdowns
  3. Position count: Trends mature. Risk should therefore be reduced after each entry so as to avoid giving back profit on last entries

Risk appetite is one of the two input variable of the entire posSizer algo. Everything else is calculated.


  1. Drawdon module

image (4)This is the equity allocated to each trade. The objective of this component is to absorb small daily volatility. As a drawdown becomes severe, surface is exponentially reduced so as to collapse residual risk. Note the slope of the curve. Small recovery results in rapid increase of the surface.

Trading floor: this is the second input variable. This is a percentage of equity balance that will be allocated if drawdown exceeds tolerance. A good example here is Millennium partners. After a drawdown of 5%, equity is automatically reduced to 50% of initial capital.

When investors say they can stomach a 20% drawdown, what they mean is they will think about redeeming after a 10% drawdown. So, it is wise to cushion the blow with this drawdown module.


Part 3: Convex position sizing in action

This posSizer runs on auto-trade Metatrader MT4. We trade closer to 30 currency pairs, leveraged at 100:1 on 15 minutes periodicity. This is probably as aggressive as it can be.

It feels like being in a driverless Formula 1, without a steering wheel, pedals for accelerator and brakes. Yet, thanks to this algo, there is no need to stay glued to a screen all day. This posSizer provides priceless comfort when most needed. It will smoothly handle trouble: reduce risk, collapse it if necessary and then re-accelerate rapidly.

This is what it looks like in practice. Below is a hypothetical equity curve (GS stock price). The real equity curve does not have those big drawdowns, so it is harder to distinguish.image

Blue and pink lines are min and max market values per trade (MVPT). Green lines are market values for each position n1 to n4. Orange line is first entry without the drawdown module.

As equity curve rises, MVPT rises in unison. MVPT reacts rapidly to each drawdown but still remains closer to the upper bound until a more pronounced drawdown happens. Risk is reduced for each new tranche.

The drawdown module kicks in during severe drawdowns. This is the difference between the orange and green dotted line. MVPT goes down even further than minimum risk. There are times when even small positions seem too big. This ensures trades go through but at bare minimum risk. This reduces concentration, which in turn sets the stage for a rebound.

One of the problems of FFPS is premature re-acceleration after a drawdown. This leads to whipsaw in sideways markets. This is again a potential reason to drift from suggested positions. After a severe drawdown, the orange line rises faster, while the dotted line adjust re-acceleration to the speed of recovery. For example, the first drop below min risk was followed by a prompt recovery. The second one was more gradual.


Conclusion:

Under extreme stress, every degree of freedom, every bit left to interpretation has the potential for costly human error.

Position sizing often overlook the most important component in any trading system: our inner idiot. This algorithm reconciles math and affective neurosciences. It helps us “meet with Triumph and Disaster, and treat those two impostors just the same”, extract from Rudyard Kipling, “If”

In investments, does more risk really equal more return, in the long haul?

Answer by Laurent Bernut:

This morning Palermo time, Andrew Swanscott from Better System Trader podcast interviewed me. The above question came up.

The answer is Yes and it is No, the real question is when. Best analogy is driving, will driving faster get You to destination: Yes when on the highway but No when in downtown.
I define my identity as a professional short-seller. As such, I have a different relationship with risk than most people. There is an interesting paradox in short-selling:
  1. If You are wrong, your position balloons and hurts immediately
  2. If You are right, it helps less and less
So, the whole game is of short selling is about position sizing and risk management:
How can positions be sized so that they would contribute but not hurt ?
This is probably one of the tallest order in fund management.

Between Charybdis and Scylla: Open Vs closed risk dichotomy

People perceive risk as either static, as in constant or completely random.

The perilous trip of the ship of Ulysses between Scylla and Charybdis.

The perilous trip of the ship of Ulysses between Scylla and Charybdis.

Well, it is somewhere in between and it depends on how You trade risk in the first place.

It reflects back on the concept of open versus closed risk. Open risk is the tropism of mean reversion strategy. Everything hums fine until the big iceberg. Closed risk means risk is capped.
Your view of the world will shape your risk profile. If You run an open risk model then because of its inherent unpredictability You are condemned to run it at low risk ad perpetuitam.
If You run a closed risk, then You can accelerate and decelerate within the bounds of your risk tolerance.

Accelerator and brakes

This is one of the most profound discoveries I made in 2015. there are two types of people when it comes to sizing a bet: those who take risks and sometimes get hurt along the way and the risk adverse crowd who will consistently take minimal risk.
I think this relates to the essence of the question: Can I build a system that preserves capital when strategy does not work but takes risk when it  does.
I think I can answer this one with good wisdom. Please read this post:
The thought behind the math was this: is there a middle ground between pedestrians and F-1 racers ? I think I found the formula. Please read the above post. We have used it and it does wonders, beyond what i theoretically expected in fact:
  1. When good times roll over, risk per trade is extremely responsive: brings risk to minimum right away.
  2. Concentration decreases: smaller risk per trade means smaller positions, means lower concentration , more positions, diversification
  3. But because surface does not change dramatically, position sizes are fairly reasonable. They do not swing from 0.15% to 15%
When the sh*** hits the fan, everything goes into Guantanamo, but it can still trade and thereby reboot itself.
  1. The skew of the convexity means that every marginal cgains translates into buying power restoration
  2. That posSizer is the best sleeping pill i know
Conclusion
I am sorry if i came across as boasting this position sizing algorithm. The point was that nothing is static. The answer You are looking for is in your position sizing algorithm.
Subscribe to my website to get free material, resources. Subscribers have free resources, files, code. Moreover, your feedback keeps me going on Quora
In the end, ask yourself this question every time You think about sizing a position: can I live with earning a little less than I could or lose a lot more than I should ?

In investments, does more risk really equal more return, in the long haul?

Trading Journal 2016/01/20

This is a test. If You find value in this trading journal, please let us know. If there are topics You would like to see covered, please comment and suggest. This journal exists only because You find it useful. So, help us create something You need.

1. No signals today

2. Trading activity Last night. Risk at this stage of a sell-off

3. General considerations:

  1. The vaporetto has left, there will be one coming soon: don’t short now, wait for the squeeze
  2. TIP of the day: counter-interintuitive truths about crowded shorts and performance during sell-offs (must read for novice short sellers)
  3. Position for the squeeze and beyond

Trading

Last night there was another Short EPOL, the ETF for Poland.

Here is how to read the chart:

Direction: Short. Comment: Trend is clearly fast bearish with low volatility. That trade has packed a lot of octane (reward to risk / holding period)

Stop Loss: 18.18

Target price: 15.97

Max Risk Per Trade suggested: -0.39% ( per convexity algo, not the standard -0.10% that will give readers a clean multiple). That is 95% of risk per trade

Trading Journal

RIsk: I elected to allocate -0.29% of risk. Risk is a number, not a dissertation. These are the reasons:

Pros:

  1. This is the third tranche. There is embedded risk free P&L of 0.53% that gives some cushion.
  2. More importantly, the lot size is such that only a small move is necessary to be able to cover a large portion and subsequently break even. It needs to generate 0.08% in order to reach break even level
  3. Current position before trade is getting small. It needs to be replenished

Cons:

  1. Trend is maturing. Borrow cost has increased accordingly. This is the third tranche in less than 4 months. Time for a break maybe ?
  2. Correlation increasing across asset classes, synchronous shorting is dangerous, so tone down the risk, take off -0.05%
  3. Rebound was small in duration and magnitude. It may be a false positive. In those fast trend it is either mid section, either before the rebound, take off -0.05%

Verdict: take the trade, but because of synchronous sell-off, reduce risk

3. General market considerations

If You haven’t shorted yet, it is too late. Vaporetto has left. Do not jump onboard now, You’ ll drown and feel stupid. Be patient, keep your powder dry.

Time is better spent observing the markets and observing your thoughts. Journal your thoughts. Observe the monkey on your shoulder.

Homework: this is a great time to get ready for the next campaign: (I have a system so I don’t need to do this anymore), but here is what I would look for: the weakest stocks that are not heavily shorted. Those are the stocks that Long holders sell.

Now is the time to think about the upcoming squeeze and beyond

The probability of a squeeze increases day by day. It is about time for a bit of mouth flapping. They call it reassuring the markets these days.

When they turned off free monetary booze, they expected a bit of weening turbulence, some whining, so no big deal so far.

Now that the vaporetto has left, let’s wait. When the squeeze comes, cover positions (half if You don’t have a system), or break even level if You use a similar equation as mine.

There is no need to cover it all. Markets have turned bearish, so the idea is to cover a portion, ride the squeeze and then slap another tranche.

Roadmap

When the squeeze is over, I will gross-up my leverage. At 127% Gross, -62% net, -22% net at risk today, I am under-participating. The idea was to start the year slow, build some performance cushion and gross up gradually. Bad idea to start sprinting at the beginning of a marathon.

So, when the squeeze comes, net at risk should drop to sub -10%. After the squeeze, gross up so that the net at risk be around -50/60%. This should be a gross of roughly 180-200% .

Now, life is usually what happens when You had other plans.

TIP of the Day: counterintuitive truth about short selling

You will usually find an inverse correlation with borrow utilisation level and performance in sell-offs. In other words, stuff that is heavily shorted all year round holds its ground during sell-off. Money is not made shorting the same stocks everyone shorts: Elvis has already left the building.

Money is made spotting the stocks that are not heavily shorted but underperform the markets. It makes counterintuitve sense: the market participants selling are Long holders selling their positions. Information has not traveled yet

These are the guys we will stalk, these are the guys whose coat we will tail. They are going through a process of grief: Denial, Anger, Bargaining, depression and acceptance. I quantified the process a few years ago. In fact, it was my first public speaking opportunity.

More about this and the Kubler Ross grief model applied to the markets on my website at www.alphasecurecapital.com . Please subscribe, It keeps me motivated. It is free and has resources for committed traders.

Conversely, make a note of the heavily shorted stuff that outperforms or holds its ground. This is squeeze box material where all the structural short sellers go impale themselves.

What is the difference between stock trading and gambling in a casino?

MonteCarloAnswer by Laurent Bernut:

I’ll give You the same answer I gave two CIOs of Fidelity. The common point between professional poker players, star fund managers and street hookers is that they go to work: it is not meant to be fun.
Excellent question. Beyond taxes and manufactured negative gain expectancy, there is much market participants could learn from professional gamblers:
  1. Gambler’s serenity prayer: grant me the serenity to accept folding a losing hand, the courage to take calculated risk and the wisdom to know the difference
  2. Cut losses and run winners: in poker, money is made by folding a lot and be aggressive a few times. Successful fund managers spend their time cutting losses. The paradox is that the way to win the war is to accept losing small battles
  3. Position sizing: Black jack is a game where You play against the house. It is manufactured to have You lose. Yet, Edwin Thorpe, whose track record towers Warren Buffet’s, beat the dealer. His method forced casinos to adapt. His secret sauce was position sizing, a fraction of Kelly criterion
  4. Position sizing algorithms: Gambling is a far more mature industry than investing in the sense that a lot of position sizing algorithms used in finance come from game theory. Martingale, reverse-martingale, drawdown/run-up of bankroll, Kelly Criterion
  5. Gambling is boring: hookers, poker players and star managers go to work. It is not meant to be fun. They leave their emotions at the door. Treat gambling and markets as a job so that You can fleece the emotional players
  6. Gamblers have a system: gamblers are not smarter, they have smarter gambling habits. Adherence to a system takes discipline. Reinforced discipline is called habit
  7. Gambling as trading is not a zero sum game: one of the most common myths about the market is the zero sum game. Slippage, commissions erode however slightly the account. Take every trade as if You put a chip on the table
  8. Quantified risk: the notion of calculated risk has unfortunately been perverted by those who do not understand it. Risk is not an abstract dissertation at the end of an investment thesis. Risk is a hard cold probabilistic number
  9. Odds and win rates: one of the fallacies of market participants is the belief they need above 50% win rate to be successful. 2 things here: 1. trading edge or gain expectancy shows that low win rate can be compensated by big payouts. 2, Distributions of P&L of most traders (excluding mean reversion and market making) show aggregate win rates over the cycle of 30-45%. Winners compensate for losers. The important lesson here is that traders walk into a trade expecting it to win, when they should be mentally prepared  for a loss. Pre-packaging grief (see my post: The view from the short-side: how we process emotions and the market signature of the 5 stages of grief Kubler-Ross by Laurent Bernut on Alpha Secure ) . This means that throughout the cycle, styles come and go. Making money means knowing when your style is out of favour and betting small and then when in fvaour take risks. Back to the serenity prayer
Conclusion
Investors usually look down on gamblers. Yet, there is much to learn from gamblers. How come a few of them become successful despite built-in unfavorable odds ?
Beginners in both markets and gambling believe they are on to something when they double down after each loss. They believe that their luck is about to turn, so they use martingale (it comes from the French for winning streak). They just forget two things: dice have no memory so each run is independent from the previous one. More importantly, the maximum expected value is break-even. This means that any outcome other than the best one carries an interesting probabilistic property called “certainty of ruin”.
In other words, there is a reason why casinos have gold, marble columns, master paintings and rookie gamblers go broke…

What is the difference between stock trading and gambling in a casino?

Has anybody gotten rich through automated trading?

Happy New Year from Alpha Secure Capital. This was an answer to a question on Quora. It has been read by more than 16,000 people.

Now, I am a digital nomad investor: Viet Nam, Singapore, Tokyo, KL, Venezia, Palermo, Reikjavik. Rents get paid in our sleep, balance gets bigger by 1-3% every week. Dream life, hey (*) ? Well, it came at great sacrifices.

Autotrade sub 30 mn is the tallest order in the trading industry. On the one hand, there are HFT shops, with whom there is no point competing. They already do a wondeful job at killing each other not so softly. On the other hand, point and click prop shops ecking penny after penny. Then, there are Delta one and deriv desks arbitraging small corners away. All those guys have the money, the resources, the access, the info, the programmers You will never have. You are outgunned, outnumbered and let’s face it: outside. Now, let the race begin.

It took me 15 years to mature the concepts, 3,694 hours to code, 3 2/3 years to run  and a lifetime to refine them. This has consumed my life, my waking hours, my sleep. Ever woke up breathless and feverishly write equations ? I nearly burned the house not once, but twice, because i forgot that there was something on the stove, while i was wrestling with some C#. Once, my wife came yelling at me for not taking care of our screaming baby. I just did not hear our daughter crying… on my lap. Well, code would not compile…

Sisyphus stones
Then, there is the sheer frustration of never being enough. Then there are bugs. One rule of thumb, never add, always subtract, always come to simplicity when solving bugs. Then, there are “100 year flood”, perfectly rhyming with the late “100 nights of solitude”. Then, there are platform issues. They are not meant to do scale-out/scale-in and adaptive position sizing. Then, there are those small issues that You will have to face one after the other.  There will be times where You wander and meander like Ulysses, “what if this, what if that ?” But there also those immensely gratifying days when You wake up with light and equations flowing through like when I found my personal holy grail of position sizing

After the Daedalus of development, one day the end will be in sight; it will be there, almost, just a few modules away. But then, there are those shortcuts You took 10 iterations ago that will come back and bite You. They stand between You and the finish line. And You know that tackling them means overhauling the entire architecture.
This is the realm of frustration. The last mile is always the hardest. Please remember this though: autotrade is like watch-making. Until the last cog fits in the right place, your clock will always be off, so don’t give up, never give up.

Then, You run your own money, face drawdowns, go back to fix the last few bugs. Then, You run it on small amounts. The best moments are not when You make your previous monthly salary in a week while kitesurfing or going wine tasting. The most beautiful moments are when You make those few hundred dollars week after week and when You finally know it is viable. It feels like watching a flower blossom. This is the best sleep You will have in your lifetime, well at least for 3 months …

Here are the lessons I learned. A viable trading system is built backward:

  1. Focus on the short side: the short side is notoriously harder. If Your system works on the short side, it will work on the Long side. Any 3 star Michelin chef can flip burgers. Now how many Burger king employees can do 3 star meals ?
  2. Focus on the exit first: a race is never won until the finish line is crossed. Some of your positions are marathonians, some are sprinters. You never know until You see them on the field.
  3. Stop loss: it is the only variable that has a direct influence on 3 out of 4 variables of your trading hedge
  4. Money management is key: how to preserve capital when your system won’t work and how to take calculated risk when it does ? This is where the heavy mathematical artillery should be concentrated, not on the entry. Think about it: everyone owns Apple. The difference that makes the difference is how big You are
  5. Simplicity: complexity is a form of laziness. If your solution is still complex, it means You have not worked hard enough to find a simple one. There is no exception to this truth
  6. Symmetry: once the short side delivers, translate it to the long side. You will have unambiguous signals, unified risk management
  7. Watch Star Trek and the original Kardashians, they were not as villains as the newer ones, breaking bad, desperate house wives etc
  8. Then, last and very least, but first take the dogs out. And then finally, sorry don’t forget to water the plants first. And then finally, oops have You called your mother yet ? And then finally, take the trash out and after a good night of sleep, You may think about entry. Entry is at the very bottom pile of the priority list of an autotrade strategy, long after labeling priorities on multiple positions

In the end, You will realise that the goal was never about money. It was first about the freedom from a paycheck and the long term uncertainty of retirement. Rich and wealthy are not synonymous. Rich should be the experiences You accumulate over your life. Now, we live out of our suitcases, frugally as usual, but what a life! Speaking of which, time for a Prosecco with our neighbours, our landlord the architect and his buddy the last Gondola maker in Venezia

(*) Now, the highlights of our week is to hunt for consecutive stop losses. We have excess capacity. We have suffered a great deal coming up with our strategy on MT4. Most modules had to be built from the ground up. We  genuinely want to spare this Sisyphean ordeal to aspiring autotraders.
So, we will choose 2 or 3 people and help them build their strategy.
I can help anyone formalise their own strategy through a thorough guided discovery process. This is not pleasant.
Then on the MT4 coding side, the person I work with is a senior programmer for the US Department of Defense (be nice to him or he will bring democracy to your computer…). I can code alright, but his stuff is military grade… Reach out if You are interested, or if You like what You read

Has anybody gotten rich through automated trading?