Posts

Are forex signals useful in making profits?

This question originally appeared on Quora


This great question has done a remarkable job at baiting scam-artists. Whoever answered “Yes”, followed by a link to some website is a scam-artist

The one-eyed scam-artist leading the blind

Everyone wants to gain this mysterious esoteric called trading edge. Well, trading edge is not a story, it is a number and here is its formula:

Gain expectancy = Win% * Avg Win% – Loss% * Avg Loss%

Tattoo it where you can be reminded throughout the day (Tramp stamp on your better-half is probably off limit). There are two modules to any trading strategy:

  1. Signals: exits first, last and very very very least entries
  2. Money management: position sizing

The scam artists who answered yes, referred to hereafter as Yes-men will provide dummy statistics about entries but conveniently forget everything thereafter. Entry is easy. You can buy a boat, a sports car, a vacation home any day of the week. Good luck reselling it. Bad entry can be salvaged, bad exits can’t.

Then comes position sizing. Signals conveniently omit position sizing for a good reason. It is a function of win rate and stop loss, both of which are either omitted or optimistically manufactured…

Implicit adoption of a trading system

Now, who does not like to wake up, receive a bunch of signals, pick one or two, send the trades and watch the money roll in? I certainly would love to, except it does not work like that.

Even if signals are thorough enough to encompass all the necessary elements from entry to exit including risk, it still omits the most important: following someone’s signal is adopting her belief system, formalised in a trading system. Example: as a professional short seller, i am naturally risk-adverse (prudent position sizing) but disciplined (take the trade, follow the system). This philosophical tenet transpires in my algorithms. This may not jive with someone who likes big high conviction bets.

Even supposedly objective systems such as deMark have several subjective degrees of freedom. The best example comes from the Market Wizards series. Those wizards have completely different strategies that sometimes seem to contradict each other. Yet, they are profitable because they have a system that suits their personality. When You follow someone else’s system, remember that you half-heartedly embrace someone else’s personality without fully understanding it.

How to spot a scam artist?

First, those who answered Yes and attached a link are scam artists. Coming out was not so tough after all, was it?

Second, here are classic red flags:

  1. No real money live track record = SCAM: Myfxbook provides live track record, so no excuse
  2. Entries only: no exit, no stop loss, no risk, no stats means SCAM
  3. Rosy stats: 70%+ win rate means SCAM. We all want to follow a system that is right 100% but the reality is the best traders LT average win rate is around is largely below 50%
  4. easy money: no you will not turn $500 into $2,000,000 in 2 years. Veteran pros with decades of experience dream of achieving 20% per annum. Scam artists who promise you can achieve 100% returns= SCAM

Conclusion

Basic rule of thumb: we are in finance, assume everyone is a scam artist until proven wrong. Good news, You can cross a few names off the list

#Quora: How does one address the issue of regime shift in algorithmic trading?

How does one address the issue of regime shift in algorithmic trading? by Laurent Bernut

Answer by Laurent Bernut:change-of-season

Fascinating topic that has kept me awake for years. It is a thorny issue. As the patent clerk Einstein used to say: answer are not at the same level as questions. Answer is not at the signal (entry/exit) level. These are position sizing and order management issues.

Definition of regime change

Everybody has a savant definition, so i might as well come up with a simple practical metaphor. imagine You drive at 150 km/h on the highway and then all of sudden, this 4 lanes turns into a country road. If You do not react quick, you will go tree-hugging.

There are three market types: bull, bear and more importantly sideways. Each type can be subdivided into quiet or choppy. So, we have six sextants. Regime change is when market moves from one box to another.

It can be either a new volatility regime, or a move from bear to sideways, sideways to bull or vice versa. Markets rarely move from bull to bear. There is some battle between good and evil.

Why it matters?

Many strategies are designed to do well in a particular environment. They make a lot of money that they end up giving back when regime changes. Examples:

  1. Short Gamma OTM: sell OTM options and collect premium. Pick pennies in front of a steam roller. 2008–2009, August 2015, CHF depeg, Brexit etc. 1 day those options will go in the money and game over
  2. Dual momentum: trade the shorter time frame but determine regime on longer time frame. When market hits a sideways period, market participants get clobbered on false breakouts like poor cute little baby seals
  3. Mean reversion: works wonders in sideways markets until it does not. An extreme version of that is Short Gamma
  4. Value to growth and vice versa: that is probably the most lagging one. By the time, my value colleagues had thrown the towel and loaded up on growthy stocks, market usually gave signs of fatigue…
  5. Fundamentals pairs trading: relationships are stable until market rotation. For instance, speculative stocks rally hard in the early stage of a bull market, while quality trails. Example: Oct-Dec 2012, Mazda went up +400% while Toyota rallied +30%

The vast majority of market participants are trend followers, whether it is news flow, earning momentum, technical analysis. Trending bulls they do great, trending bears, they can survive. Sideways is where they lose their shirts on false positives.

The issue often boils down to how to enter a sideways regime without losing your shirt

The value of backtests

I agree that backtests will help you identify when your strategy does not work. This is actually the real value of backtest. This is when you modify the strategy and adapt the position sizing to weather unsavoury regimes. Then trade this version, not the ideal fair weather strategy.

Reason is simple: everybody’s got a plan until they get punched in the teeth. So don’t lower your guard, ever.

Asset allocation across multi-strats

Some market participants like to develop specific strategies for specific markets: sideways volatile, awesome for pairs trading, great for options strangle/straddle short. Breakouts are good for trending markets etc.

How do You switch from one to the next ? Fixed asset allocation is as clunky, as primitive and as MPT as it gets. There is something far more elegant and simple:

  1. Calculate trading edge for each sub-strategy: long Trend Following, pairs etc
  2. pro-rate trading edge for each strategy
  3. Allocate by pro-rata
  4. Allocate a residual minimum even to the negative trading edge strategies

This is a simple way to put money where it works best

Regime change for single strategy

When not to trade

Van Tharp believes that there is no strategy that can do well or at least to weather all market conditions. I believe there is more nuance. Is the objective to make money across all market regimes? For example, sideways quiet are preludes to explosive movements. In order to make any money, you need to trade big and if you are on the wrong side when things kick off, game over

We trade a single unified (mean reversion within trend following) strategy. What follows is our journey through solving the regime change issue. We found that the three best ways to manage regime changes are

  1. Stop Loss:
  2. position sizing:
  3. order management:

Stop Loss

Regime changes are usually accompanied with rise in volatility. Volatility is not risk, volatility is uncertainty #de-friendSharpeRatio

We used to have a complex stop loss rule. Now we have a uniform elegant stop loss. It just lags current position. It is fashionably late, hence its name: French Stop Loss.

The idea there is to give enough breathing room to the markets to absorb changes without giving back too much profit.

Our solution is to consider stop loss as a fail safe and allow the market to switch direction bull to bear and vice versa within the confine of a stop loss.

The result is we end up switching from one regime to the next more fluidly. We have reduced the number of stop losses by 2/3, which in turn has materially increased our expectancy.

Stop losses are costly. They are the maximum you can lose out of any position.So, unless you have a kick ass win rate or extremely long right tail, you want to reduce their frequency and allow the market to transition.

Position sizing

The first thing You need to understand is that You cannot predict/anticipate a regime forecast. You will find out after the facts. This has some immediate consequences on position sizing: always cap your portfolio risk

Many position sizing algorithms use equity in layers or staircase. We base our calculation of peak equity. So, drawdowns however small have an immediate impact on position sizing. This slams the break much faster than any other method i know.

The other side of the equation is risk per trade wich oscillates between min and max risk. When regime becomes favourable again, it accelerates rapidly.

The whole premise is early response to change in regime through position sizing

Another feature is trend maturity. Betting the same -1% at the beginning and at the end of a trend is asking for a serious kick in the money maker. Trends are born, grow, mature, get old and eventually die one day, just like believers in Efficient Market Theory. So, risk less as you pyramid.

Order management and hibernation

Along with the position sizing comes a vastly underrated feature in most order management: trade rejection.

Secondly, we use a position size threshold. When markets get too volatile and we experience some drawdown, stop losses dilate. As a result, position sizes get smaller. When sizes are too small, trades get rejected.

Order management is vastly under-utilised in most systems i have seen. It is often binary, all-in/all-out, or one way scale in or scale out.

In our system, taking profit off the table is a not a function of chart, technical analysis but driven by risk management. Until price goes a certain distance, exits are not triggered. If exits are not triggered, entries cannot be triggered either. Since volatility goes up and position sizes get smaller, the system drops into hibernation.

We have factual evidence that hibernation during an unfavourable regime is a powerful mechanism to weather regime change. It involves a lot more sophistication than muting indicators, slope flattening etc. It encompasses position sizing, order management, stop loss and to a lesser degree signals.

Conclusion

Multi-strat asset allocation based on pro-rated trading edge is the easy way to go.

Single strat across multiple market regimes means acceleration/deceleration but also hibernation. This is not an easy problem. There is one thought that kept me going through the frustration of figuring this out: “Building a system is like watch making. Time will always be off until the final cog fits in”

How does one address the issue of regime shift in algorithmic trading?

10 myths about short selling

Steven Spielberg’s movie Jaws has changed forever the way we perceive sharks. Did you know that deep in the comfort of your house lies  something 150 times deadlier than any great white shark ? The probability of dying falling out of bed is 1 in 2 million.  The probability of dying as a result of an exploratory shark bite is 1 in 300 million. Fortunately, we are not on the menu; sharks apparently don’t like junk food.
Like sharks, short sellers are fragile and misunderstood creatures. They are not the nefarious speculators. We are your pension’s best friend
[This is one of the chapters of the upcoming book: “the wisdom of short sellers”. We value your comments and feedback. So, please, help us helping You]

Myth 1: short sellers destroy your pensionbest-friends-forever-glitter-for-myspace

Would it be fair to say that people who hurt your pension should to be fired ?
According to www.Spiva.com, around three quarters of active managers trail their benchmark year after year. Your pension account is therefore better off with passive funds rather than expensive active managers. In bear markets, active managers might claim they outperform their benchmark, when the reality is they still lose money.
Your pension account does not need short sellers in bull markets. During bear or volatile markets, short sellers do make money. Counter-cyclicality is in the job description. So, all your pension account need is an allocation algorithm (see chapter on asset allocation by trading edge) to deploy between passive long funds and active short sellers.
Conclusion: Who is your friend ?
  1. Long Only active managers who have a sustained long term track record of hurting your pension
  2. Short sellers who will make money when the going gets rough.

Isn’t it fair to say that short sellers should be your pension’s new BFF ?

Myth 2: Short sellers destroy companies

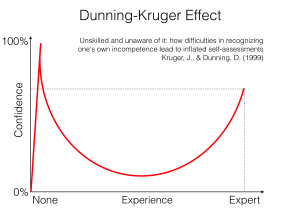
The wisdom of short sellers is rarely welcome at executive boardrooms. As a result, they cannot bring healthy balance to the Dunning Dunning-KrugerKruger (*) dark side of the force. Senior managements at companies like Apple (round 1), Lehman Brothers, Kodak, Enron, GM,  Volkswagen are perfectly arrogant, incompetent and stubborn enough to run their venerable institutions into the ground themselves. Short sellers do not compound sub-optimal executive decisions, otherwise referred to as stupid mistakes. They see something going down  and just hop on for the ride.
 (*) Dunning Kruger effect is a cognitive bias in which people are so incompetent that they actually believe they are talented. This affliction is quite prevalent with senior management operates at such altitudes in the layer cake that they incorrectly believe it does not have to stink any more. This is reinforced by an obedient bozocracy,  bureaucrats whose sole “raison-d’etre” is to vigorously acquiesce.

Myth 3: Short sellers manipulate markets

Back in the days, a celebrity hedge fund titan used to publicly announce his investments in Japan. During the ensuing rally, retail flow remained strangely net seller, despite all the hype on investment blogs and chat rooms. Moreover, after-hours dark pool activity showed big blocks were exchanged. Someone was going through great length to discreetly unload a big position…
Had this manager done the exact same thing with a short instead of a long position, he might have attracted a different kind of attention. The public and the regulator do not take it kindly when someone publicly short sells across the nation pension funds large holdings. If You are a short seller, You will be audited. So, it is in your own self preservation best interest to strictly abide by the Law at all times.
If your business model revolves around putting on big short positions and then talk your book, then stop reading this, go buy some coffee mugs and lots of cheap coffee, because “los Federales” are on their way.

Myth 4: Short sellers want the demise of the economy

As we will see in this book, short Selling is a relative game. It comes down to selling the stocks that trail the index and buying the ones that outperform it. There is nothing nefarious about this type of arbitrage.
When market participants turn a bit more risk adverse, speculative stocks tend to come down harder and faster than the boring ones. Your average pension fund manager certainly had initial healthy professional skepticism as to the long term prospects of www.pet_cemetery_in_outer_space.com internet start-up or www.cash_crematorium_diagnotics.com biotech venture. Yet, he just felt pressured into buying, because everyone else did and he did not want to be left out trailing the index. This would cost him his job. Now, that things have hit a bit of a “soft patch”, he is left scrambling to liquidate this toxic nonsense. It is unfortunate that pension accounts end up littered with hollow buzz stocks, but again, short sellers are not responsible for other managers suboptimal investment decisions. They just short-sell underperformers.
 

Myth 5: Short sellers destroy value

Short sellers do not destroy any more value than shareholders create any. If You buy a house, a car, a pen today for 100 and resell it tomorrow for 105 without having done anything to improve it, You have not created any value. You have just made a profit of 5. This comes from a confusion between market capitalisation, value and valuation. The press likes to associate market capitalisation going up or down with value creation or destruction. Warren Buffet said: “price is what You pay, value is what You get”

Myth 6: short sellers are responsible for the collapse of share price

Short sellers need to borrow stocks in order to take short positions. Borrow availability is usually between 5 and 10% of the free float, or shares publicly traded. This represents between on and two weeks of trading volume. Short sellers do not have the fire power to durably affect share price.
Short sellers and big mutual funds have access to the same information. Share prices collapse as result of Long-Only heavy artillery selling, not small time short selling BB gun.

Myth 7: Short sellers accentuate market volatility

Some jurisdictions ban short selling. As a result, buyers can only purchase from a long seller. Sellers can only sell to Long buyers. This widens the bid/ask spread, which increases daily realised volatility. Market participants sell short for different reasons. It is often a way to hedge other transactions such as options, convertible bonds, preferred stocks, baskets etc. Inability to sell short reduces liquidity, increases volatility and ultimately penalizes all market participants. Banning short selling is often a sign of immaturity.
 

Myth 8: short selling increases risk

In theory, unsuccessful shorts can rally multiple times but only drop by 100%. Short-selling is risky, no doubt.
Yet, adding a short book to a long one reduces correlation to the index. It reduces portfolio volatility. The ability to sell short enables alpha generation not only in up but in sideways and down markets.
Think of it as boxing. If You stepped into the ring with Mike Tyson, and chose to punch only with your right hand, what was a tough fight to start with, will be a brief one too.

Myth 9: I don’t need to sell short during bull markets. I will just put on some shorts when the market turns bearish

Short selling is a muscle. It atrophies when not exercised. It is safer to learn the craft during bull markets when the long side can sponsor the tuition. Waiting for the bear market to show up is too little too late. It takes time, effort and money to master the skill, especially the mental side of short selling. Meanwhile, investors are notoriously impatient during bear markets. “the best time to repair the roof is when the sun is shining”, JFK

Myth 10: Short selling has infinite downside potential

If short sellers allow their positions to go up against them multiple times, then they deserve to be un-apologetically weeded out. Short-sellers is an extreme market sport. Joe Campbell got famous after breaking the three basic rules of short selling:
  1. always place a stop-loss: if You don’t have an exit plan, then You will not like what the market has in store for You
  2. control risk through position sizing: the most important question about fund management is: would You rather earn less than You could or lose a lot more than You should ?
  3. stay away from crowded shorts like penny stocks: risk is a binary event: either bankruptcy or recovery.

[Comments, feedback are uppermost welcome. This is a collaborative effort]

Better System Trader: Questions from the audience

These are questions from the audience on the Better System Trader podcast with Andrew Swanscott. I am honored and humbled by the interest of listeners. We did not have time to cover all questions, so here are some written answers. If You have questions, please feel free to ask

Trading Psychology

From: Jim

The mind plays tricks on us, even with a successful system, as a system trader, what methods to use for the mental part of the system trading?  So meditation, journaling but how to implement them in one overall plan?

EXCELLENT QUESTION: Part 2 of the book will focus on this

  1. You cannot trust your mind. Michael Gazzanikas 1964 split brain theory. Self-deception: (Daniel Goleman) is a built-in feature. It happens automatically and covers its own tracks and designed to deceive us.
  2. Accountability: simple exercise to test validity of prediction and convince us we are unable to predict.
  3. Reframe from outcome to process: develop a system, account for signals generation and be honest about signal execution
  4. Daily market journal: write what You think markets, thoughts, things that happen, small comments, ideas, formulas. Do the James Altucher method: keep a moleskin with You at all times. Deliberate practice: activates the Default Modal Network (Olivia Fox Cabane)
  5. Write about the thoughts that cross your mind:
    1. dreams and aspirations when making money, why You keep doing that, why You like it. How does it manifest in the body
    2. fears, pains, detail, reflexes (ex: read the press, look for expert opinions): be specific and commit to writing or dictating. Very important
  6. Walk through your fears: meditate and manifest your fears. Seneca was history’s first investment banker. He also happened to be the founder of stoicism school of philosophy. He advocated one day a month of living frugally as a form of inoculation.

Another post on the topic:

From: @trader1970

So far as a Trader what is the biggest fear that you have not been able to overcome?  How do you manage this situation?

  • My father had a hemiplegia (brain stroke) when i was 7. He never regained motor skills and speech ability. We fell into severe poverty. As a result, I have a deep seated fear of becoming handicapped and not being able to feed my family anymore. Personal and vulnerable. Markets related fears I can deal with, I am a short seller, this is a versatile skill
  • How does it manifest itself in trading:
    1. Diversify sources of revenue: we have a real estate business that generates enough to cover our primary needs. That provides peace of mind. My family is safe from harm
    2. Frugal lifestyle
    3. Systematically take less risk: when making sizing arbitrage ask yourself, would You be satisfied with earning a little less than You could or losing a lot more than You should ?


Position sizing

From: Bass

Tell us more about risk management, Volatility based Stops and position sizing.

  • It really depends on your customers: Investors are like teenage girls: Teenage girls say they want a nice guy and they fall for bad boys. Investors say they want returns but they react to drawdowns:
    1. Magnitude: never lose than what investors are willing to tolerate
    2. Frequency: never be the last person investors think about before going to sleep
    3. Period of recovery: never test the patience of investors
  • Risk is not a story, risk is a hard number: it manifests itself in individual trade risk per trade (RPT), in aggregates exposures. Example: Long small caps / short futures is synthetically residually Long large caps as the index is primarily composed of large caps
  • Volatility stops: swings +/- 3 ATR. Volatility is as welcome as Kanye West at an award ceremony. Bad news, volatility is like Monsieur Kardashian bad manners: it is here to stay. Your job is to ride it and the way to do so is position sizing. For example, biotech and internet stocks are more volatile than department stores for example. So, size them accordingly.
  • used in position sizing. Rank trades by size (bigger first) so as to go for better volatility signature


From: Derek

Hi Laurent,

I have been following your website ASC for quite some time and also your answers on quora. I have something related to an answer you had to a quora question In investments, does more risk really equal more return, in the long haul? Your answer immediately clicked with me and it logically made sense to me. Laurent – you may want to quickly summarize what the answer was before we move on to the next part of the question. I’ll ask you what the answer was.

 Would you please elaborate on your convex position sizing method for a risk per trade and draw down module. This was discussed as an answer on Quora. I understand that as you make money you will allocate a larger risk budget using a convex surface with a max risk budget of -0.30. But i do not understand the reverse side of this, the draw down part.  As we get more draw down we should decrease our risk budget again using a convex surface. It starts at 100 and bottoms out at around 35. I do not understand how that part works.

 Also how did you come up with this method? Can you give a practical example of when you used this both for drawdown and additional risk scenarios?

Thank you very much

Derek

Here is a complete article on the topic. Thank You very much for asking

  1. Long Side: people add risk. Short side; frequent squeezes, start from manageable risk then reduce
  2. Metaphor of accelerator and brakes. Optimum fuel consumption happens when You do not solicit brakes. It clicked while listening to Larry Williams interview on the famous Better System Trader after bringing my daughter to the Hoikuen (crèche in Japanese)
  3. Market Value (MV) = AUM * Risk Per Trade (RPT)
  4. Most position sizing formulas will use one side RPT usually to calculate risk. In my case, this is convex so as we make money take more risk. This is accelerator. You want this to be responsive and nervous so to re-accelerate quickly after drawdown
  5. Meanwhile, when strategy stops working, You need to trade minimum risk. The problem with conventional formulas is that brakes are spongy and re-acceleration slow. You can get whipsawed. Which then erodes emotional capital, which leads to downward spiral. (Feedback loop between emotional and financial capital). By allocating a convex surface, AUM drops dramatically very quickly but then re-accelerates as there are signs of life
  6. Practical example: ETF. At the moment squeeze so drawdown, then surface immediately reacts and I naturally trade smaller. Residual open risk in my latest short entry was -0.12%, down from min risk at -0.25%

Trading Edge

From: Marcia

During your interview in episode 32 you talked about the “Edge” formula, which is, I think, ” (%wins X Average Win) – (%Losses X Average Loss) “? Would you talk more about that and what number you are looking for, or, what insights the number gives YOU?  thank you

Thank You very much. I am writing a book on short selling. Part 1 is about how to build a statistical trading edge. Part 2 is about building a mental trading edge. Part 3 is about constructing a portfolio with a positive trading edge. On the Long side, the market does the heavy lifting. On the short side, the market does not cooperate, so building a trading edge is critical

  • I am looking for positive number. I have never looked for a specific number, thank You for the suggestion
  • Use as asset allocation tool:
    • Plot trading edge by side and strategy
    • Pro-rate trading edge
    • Allocate resources (trading AUM or surface) based on trading edge, with floor and ceiling
  • This is useful for multistrats portfolios where You would systematically allocate resources to the best performing strategy

Shorting strategies

From: Adonis

What are the 3 most successful triggers he uses in going short? Does he use daily or weekly charts?

There were originally several variations on two strategies (mean reversion and trend following). Over time i have managed to merge them into one.

  1. Define trend: lower highs, lower highs
  2. Wait for roll-over: maximum information: volatility, swing high
  3. Enter on next bar

Exits:

  1. stop loss: full
  2. trend reversal (logical time exit): entry qualified on the other side happens within stop loss
  3. partial exit: risk reduction, take profit objective is to break even

Now, the delicate part is not in the signal module. Trading suspension for example is not a signal issue but a position size one. If sizes are too small, then trades are rejected. For example, sometimes currency pairs flip-flops between bull and bear. So, we count entries and add penalty for each full exit. This reduces risk per trade. If the overall equity is ain a drawdown, then position sizes get smaller. If they are too small, they are automatically rejected. This allows us to trade more pairs as some of them stop trading.


From: Graham

How do you simulate borrowing costs when testing a shorting strategy?

Everything at General Collateral (GC) +0,15% added to slippage. The question is probably related to hard to source issues or crowded shorts.

Do not short issues with borrow >5%, except on the Long side: squeeze box. Do not squeeze people: it is bad karma


From: Nikhil

1)  Majority of ideas for a short strategies seem to fail rigorous testing on larger time frames so one should focus on more active time frames [5min to 2H based data] instead of passive time frames [Daily to Monthly based data]  ?

Assumption: Nikhil may trade breakdowns, because this is a classic symptom or rebound higher than entry which leads to false positives.

Solution is not in better entry signal, but in partial exit and better money management, Trading system has 3 components: exit/entry, money management and mental.


2) Can you highlight a basic idea on a short strategies variable for further research for those struggling with constructing a short only strategy ?
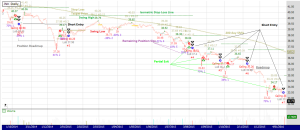
JNK Short

Sure, check post on JNK attached. It is a scale-out/scale-in system.

There are 2 certainties in life: death and short squeeze. Use squeezes to your advantage

3) What opportunities do you see in the financial industry going forward for new generation of entrepreneurs (non trading/investing related) coming up ?

At the moment, everyone wants to be in the HF game. I entered the HF game in 2003 when it was still in infancy: a bunch of cowboys blowing stuff up in their kitchen. HF is bound for yet another healthy correction.

I believe the future to be threefold:

  1. Algorithmic assets allocation: fire your financial advisor. If You don’t know why, he probably does. Machines do a better job and they don’t get kickbacks…
  2. Separately managed accounts (SMA): open a brokerage account and let algo do the heavy lifting. Funds running costs are prohibitive. Besides, there is a proliferation of single brain cells parasites called compliance. They are the TSA (US airports officers) of finance: utterly useless at catching problems but extremely annoying
  3. Active management “soft patch”: SPIVA.com. The overwhelming majority of funds underperform the index and they are more expensive than ETFs. There is a gambler’s fallacy going on: ETFs have outperformed active managers so far, but the latter will be better equipped to navigate volatility and downturns. That is gambler’s fallacy: if managers failed to outperform during easy times, why would they even succeed during hard times ?

As for non-investment profession, I honestly don’t know


From: Ola

I am using market filters to keep me out of bear markets for my long only strategies for stocks, and I’m cashed up for periods of time. I find this a bit boring. What type of indicators or price action should I look for to create a short strategy to complement the long strategies? I’m looking for something simple and robust to be used on the daily time frame.

Best regards,

Ola

Check JNK trade attached. 1 Define trend, 2, enter on counter-trend move 3 exit partially as rebound comes


General trading

From: Bengt

Hello, it is often said that short trading is very difficult to make money off: Do you agree with this? If so, do you think it is a matter of the odds not being on your side or is it too much to handle mentally?

EXCELLENT QUESTION: “This is space, the environment does not cooperate… You solve one problem after another, and if You solve enough problems, You get to come home”, The Martian.

Andrew, Allow me to explain why people fail on the short side: they think from a Long perspective. This is deep shit that no-one has ever explained in statistical and psychological terms. Fascinating theme, I am writing the book on the topic and how to build a sustainable short selling practice

Example: 4 stocks: A,B Long C,D short, all start at 100

Start: Long exposure 200%, Short exposure: 200%, Gross exposure: 400% , Net exposure 0%,

A goes up by 10%, B drops by 5%. C drops by 10% and D goes up by 5%

End: Long exposure 205%, Short exposure: 195%, Gross exposure: 400% , Net exposure +10%,

Bottom line:

  1. On the long side, the market does the heavy lifting for You. There is a bigger bet on something good
  2. On the short side, the market does not cooperate: there is a bigger bet of something that does not work
  3. Net exposure is +10%. The main reason why people fail is that they want to short a throw away the key when they should be working more on the short than the long book. Just to stand still they should keep running: this is a Sherlock Versus the Red Queen effect


On the other end of the spectrum: is there an outer limit, odds-wise, for profitable long term trading, or is an 800-day breakout tougher to handle mentally than a 2 day breakout?

Best regards: Bengt

The problem is false positives: You will have many more false positives because of poor trend formation with shorter periodicity. You will deal with being systematically late. A more robust statistical approach is to deal with exits so as to move the needle from “near win” (false positive) to “near miss” (partial win)


From: Rob

Please ask for the following:

1) What works better in the forex market – momentum or mean reversion?

Mean reversion works until trend following works. It is a question of periodicity and tolerance for stop loss.

My strategy is a combination of both.

Post about two types of strategies:

2) If you had to start over from the beginning with the knowledge you have now where would you focus on and what would you throw away?

  1. Psychology: clarity about beliefs. 90% of trading is mental, the other half is good math
  2. Trading edge is not a marketing gimmick: it is a number
    1. Money management: example of convexity
    2. Exits: stop loss is the 2nd most important variable

3) You have said in the past to focus on exits and not entries – but how exactly do you do this? Is it a matter of thinking about when you will exit if you are right or wrong?

Never think about right or wrong, it is the wrong mental association that will lead to death. Think about profitable. I am writing something on the psychology of stop loss. This article is potentially the most or second most important post I have ever written.

The best analogy is diet. Diets don’t work. We are all getting fatter and there has never been as much information on diet. Diets fix the wrong thing. The problem is not what we eat. The problem is how we think about we eat. Same goes with stop loss and exit.

This is not a mathematical problem. This is a psychological issue about the meaning we ascribe to closing positions. If we associate stop loss with being wrong, the ego will revolt.

IAU option trade anecdote funny and excellent example to talk about emotional capital and Zibbibo viognier white wine blend from Etna

4) What do you think about fixed fractional position sizing

it is a good basis of any position sizing algorithm. Now, it is a bit simplistic for 2 reasons:

  1. Uniform risk taking through the cycle: think of it as a car. Sometimes it is good to accelerate, sometimes You need to decelerate. Win rate changes through the cycle and so should risk
  2. Dissociation: Long and short sides rarely work well at the same time. Since they have different win rate, they should have different risk numbers

Dissociation by side of the book, strategy using trading edge or win rate. Please check my post on convex position sizing

5) Please talk more about stops. you said in the past your stops have a large impact on your P&L – but how do you calculate your stops. What are the considerations when using a mean reversion vs momentum strategy and type of market forex vs futures.

Sure, happy to explain the equation

Now, for mean reversion strategies, the equation includes another variable: frequency. Let me give You a simple example. If you clock +0.5% per month and then have -6% month, it will take roughly a year to make that back if everything else works. So, a simple idea is to empirically come up with a patience factor. Example: never allow losses to be greater than 4 months of average profit. The difficulty though is correlation. Accidents travel in group.

Another important point on mean reversion, never trade open risk strategies. Example: short naked gamma. I was having dinner with some options portfolio managers friends. Short OTM gamma is still marketed to unsuspecting investors. Those are scams: they show consistent returns until they blow up

From: John D

I trade a long term trend following (trade every 1-3 months) system on stocks indices currencies and commodities. What type of exits would you use on this type of system?

Trailing ATR stop? Time stop? Both?

John D, You are right on all of them

Three stops:

I have developed something called box concept. Once in a trade, there are three possible scenarios:

  1. It does not work and needs to be stopped out. That is a floor or ceiling depending on whether You are Long or Short
  2. It works well and warrants some de-risking: take money off the table and leave a portion for the long right tail
  3. It goes nowhere: this immobilizes resources and needs to be dealt with

The concept is that whatever happens, it will trip one of the mines and will be dealt with. This is how it is done in practice

  1. Isometric staircase stop loss: swing +/– allowance for volatility. Markets do not go up in straight lines. They go up or down, retrace and resume their course. This method allows markets to breathe
  2. Partial trailing stop loss: take some money off the table so as to reduce risk, but leave a residual for the big trend. After taking some money off the table, it makes sense to re-enter and a add a little bit more risk.GBPJPY
  3. Time stop: buying power and trading frequency. Some stocks do not move enough to warrant either a stop loss or a risk reduction. These are the harder ones to spot. The solution is to timestamp them.

About timestamp:


What is the difference between stock trading and gambling in a casino?

MonteCarloAnswer by Laurent Bernut:

I’ll give You the same answer I gave two CIOs of Fidelity. The common point between professional poker players, star fund managers and street hookers is that they go to work: it is not meant to be fun.
Excellent question. Beyond taxes and manufactured negative gain expectancy, there is much market participants could learn from professional gamblers:
  1. Gambler’s serenity prayer: grant me the serenity to accept folding a losing hand, the courage to take calculated risk and the wisdom to know the difference
  2. Cut losses and run winners: in poker, money is made by folding a lot and be aggressive a few times. Successful fund managers spend their time cutting losses. The paradox is that the way to win the war is to accept losing small battles
  3. Position sizing: Black jack is a game where You play against the house. It is manufactured to have You lose. Yet, Edwin Thorpe, whose track record towers Warren Buffet’s, beat the dealer. His method forced casinos to adapt. His secret sauce was position sizing, a fraction of Kelly criterion
  4. Position sizing algorithms: Gambling is a far more mature industry than investing in the sense that a lot of position sizing algorithms used in finance come from game theory. Martingale, reverse-martingale, drawdown/run-up of bankroll, Kelly Criterion
  5. Gambling is boring: hookers, poker players and star managers go to work. It is not meant to be fun. They leave their emotions at the door. Treat gambling and markets as a job so that You can fleece the emotional players
  6. Gamblers have a system: gamblers are not smarter, they have smarter gambling habits. Adherence to a system takes discipline. Reinforced discipline is called habit
  7. Gambling as trading is not a zero sum game: one of the most common myths about the market is the zero sum game. Slippage, commissions erode however slightly the account. Take every trade as if You put a chip on the table
  8. Quantified risk: the notion of calculated risk has unfortunately been perverted by those who do not understand it. Risk is not an abstract dissertation at the end of an investment thesis. Risk is a hard cold probabilistic number
  9. Odds and win rates: one of the fallacies of market participants is the belief they need above 50% win rate to be successful. 2 things here: 1. trading edge or gain expectancy shows that low win rate can be compensated by big payouts. 2, Distributions of P&L of most traders (excluding mean reversion and market making) show aggregate win rates over the cycle of 30-45%. Winners compensate for losers. The important lesson here is that traders walk into a trade expecting it to win, when they should be mentally prepared  for a loss. Pre-packaging grief (see my post: The view from the short-side: how we process emotions and the market signature of the 5 stages of grief Kubler-Ross by Laurent Bernut on Alpha Secure ) . This means that throughout the cycle, styles come and go. Making money means knowing when your style is out of favour and betting small and then when in fvaour take risks. Back to the serenity prayer
Conclusion
Investors usually look down on gamblers. Yet, there is much to learn from gamblers. How come a few of them become successful despite built-in unfavorable odds ?
Beginners in both markets and gambling believe they are on to something when they double down after each loss. They believe that their luck is about to turn, so they use martingale (it comes from the French for winning streak). They just forget two things: dice have no memory so each run is independent from the previous one. More importantly, the maximum expected value is break-even. This means that any outcome other than the best one carries an interesting probabilistic property called “certainty of ruin”.
In other words, there is a reason why casinos have gold, marble columns, master paintings and rookie gamblers go broke…

What is the difference between stock trading and gambling in a casino?

What programs are usually used to back-test trading strategies?

Answer by Laurent Bernut:

Testing a strategy is a journey. For any journey, You need the right equipment. I test everything on WealthLab then program on other platforms. Here is why

The objective of back-testing is to simulate real trading. When You trade real money, You face the following problems:

  1. Position size: You do not trade 1 share per trade. You may have sophisticated position sizing algo. Platforms offering position sizing algos in back-testing phase are few and far between: WealthLab & amiBroker. QuantConnect and Quantopian may but I have not tried
  2. Cash constraint: You strategy may generate signals but if You do not have cash to execute either a Buy Long or a Buy to Cover, it is a moot point. WLD and amiBroker
  3. Portfolio rotation: this is similar to the above point. Test may look great/poor on one security but in real life, you trade a portfolio.
  4. Slippage & commission: always set slippage at max. My settings is -0.5% one-way, that is 1% slippage + commission for a round trip
  5. Volume: only academics and efficient market believers trade on thin markets and banking holidays
  6. Borrow and uptick: structural shorts are a dime a dozen. Profitable structural shorts are the unicorns of short-selling. If You find one, capture it safely and let’s study it

The journey:
The first part of the journey is to get the signal right. This is where most people stop. They identify a signal that they test across a population of stocks one after the other. This may seem fine in theory but in practice You will rapidly come across a concept called Buying Power. If You don’t have the cash, You can’t execute. If You can’t execute, then it’s all academic. This excludes primitve versions of Matlab, MT4 and older versions of TradeStation
Math formula for that level is: Signal Validity = Win%

Second stage is when You start testing at portfolio level
You have realised that signals must be executable to be worth anything.
At this stage, You will test signals. These are where most people stop. This is the province of most sell-side quants using R or Matlab. Tradestation does not go any further. Not sure about Ninja, never tested that one
It assumes all positions are equal weight. This is primitive
math is  Win rate = Win% – Loss %
Bloomberg BTST is a rudimentary version of that

Third stage is when You start working on the real trading edge formula
Trading Edge = Win% *Avg Win% -Loss%* Avg Loss%
This is when You start to realise that size does matter in the markets, particularly when strategy fails to deliver.
At this stage, there are only two platforms which deliver: WealthLab Developer and Amibroker. Both have a comprehensive position sizing library.
Matlab can deliver but You will need to buy an additional expensive module. Matlab is an expensive guillotine, hardly suitable for neurosurgery. I do not recommend it.
WealthLab and amibroker are both C#. They both have canned strategies You can learn from and a vibrant community.

Personally WealthLab changed my life. It permanently changed the way I perceive the markets.

A word about optimisation: the masala smoothie approach
When I started working on the strategy, I, as everyone else, ventured on the side of complexity. I resorted to optimistion to find the best indicator value.

Most people, most quants, love to optimise and re-reoptimise and re-re-optimise their optimisations.
Bad news: it gives the right mathematical answer to the wrong question. Optimisation is the monosodium glutamate MSG of strategies: it gives depth and substance to poor quality food.
Work on the logic, not on the value of some hypothetical Billion Dollar idea.
Do not throw everything in hoping it will stick. Optimisers will waterboard the data until it confesses everything

PS: 100% Free Kick -A@#resource:
Andrew Swanscott interviewed me on Better System Trader.
Interview with Laurent Bernut – Better System Trader
Off line, he suggested I should offer something to his audience. Here is a tool I use daily.

The Trading Edge Visualiser User’s Manual
The way to use it to load your backtest data and look at distribution. I use this tool many times a day during strategy development.

What programs are usually used to back-test trading strategies?

The four horsemen of apocalyptic position sizing used by professional investors

4 horsemenDespite picking a fair share of good stocks, it is still tough to generate some consistent serious alpha. Picking the right stocks and exiting them well tells You how often You win. How much You win, however, is a function of how much You bet. Some professional investors pay surprisingly little attention to their bet sizes. Below are four algorithm often practiced by professionals that can

  • Four popular bet sizing algorithms used by professionals that have negative gain expectancy
  • Size does matter in the markets: 1$ or 100 will have a different outcome


When it comes to bet sizing, there are only two sizes: either too much, either too little. As a professional short-seller, position sizing is mission critical. Successful positions shrink. Not only do they contribute less and less, but they also tilt exposures (net & net Beta). To add insult to injury, they become less noticeable. On the other hand, unsuccessful positions balloon. They immediately hurt. So, I have spent years studying the science of bet sizing. I sought to learn from other investment professionals. It eventually dawned upon me that Long biased people rarely ask themselves the same questions. For them, bet sizing does not have the same degree of urgency. Worse even, it became apparent that some position sizing algorithms had outright negative expectancy, or nasty side effects that they were never even aware of.

Aral Sea Ships

Insufficient liquidity

Horseman 1: Liquidity. If You can’t get out, You don’t own stuff. Stuff owns You
Getting into a position is like buying a boat, or a second house. You can do that any day of the week. Now, selling a boat is tough (been there, done that). It may take time to build a position in a stock. Time is an expensive luxury few market participants can afford when they want to liquidate.So, no matter how attractive a story may be, if you can’t exit easily, just don’t enter.

Rule 1: don’t size your positions so that they may go Hotel California on You:
“You can check-out anytime You like, but You can never leave!”, Don Henley, Hotel California


Bernie-Madoff-mugshot

Example of long conviction

Horseman 2: High conviction: feel-good position sizing
Disclaimer: this position sizing is used by the greatest and the worst investors. The classic rationale is: “if You believe in something, then you should go big or go home”. What else is it but a feel good position sizing algorithm ? Risk is not quantified but subjectively assessed. The problem is mental accounting, or the constant emotional revisionism of the situation. Jack Welch said: “what can be measured can be improved”. If You can’t quantify your risk, then don’t expect improvement in consistent alpha generation capability.

The greatest investors also use conviction as a position sizing algorithm. The only difference is that they express conviction in units of risk. They quantify risk first and then put chips on the table according to their perception of the reward. If an idea does not pan out, risk can be parred down.


Horseman 3: Equal size: one-size-fits-all and the volatility roller coaster
This position sizing algorithm will not bring ruin, but it has negative side-effects that may prevent You from achieving your obejctives in terms of performance, attractiveness to investors and quality of life…

Equal weight is a form of laziness:
First, let’s look at the math behind equal weight. All trading systems boil down to their trading edge (Avg Win% * Win% – Avg Loss% *|Loss%|). Since all bets are equal, equal weight implicitly puts emphasis on the signal, and excludes the value of money management. In other words, stock picking has to be consistently above 50% to absorb losses and generate a profit. Unfortunately, no system works all the time. So, equal weight carries cyclicality in performance.

Ignoring volatility at the position sizing level invites volatility in the portfolio
Not all stocks have the same personality. Some are more volatile than others. For example, internet stocks tend to be much more turbulent than utilities. If all positions are sized equally, then the most volatile stocks will drive the volatility of the overall portfolio. Morality, ignoring volatility at the position sizing level will in turn invite volatility in the portfolio.

Horseman 4: Average down, martingale and the certainty of ruin
Rookie gamblers always come up with some elaborate scheme to break the casino. It is usually a variation on the theme of doubling down after each loss. They believe that the losing streak will end and they will recoup their losses. This position sizing algorithm is known as martingale. Let’s look at the math behind this algorithm

1. Adding to a losing position reduces the hit ratio
2. even if You had infinite capital, the most favourable outcome would be break-even. First, do You have infinite capital ? Second, any other outcome before the most favourable one carries an interesting probabilistic property called certainty of ruin
3. Doubling down means adding to losers. Resources have to come from somewhere, probably winning trades. Books written by successful market participants always emphasize “cut losers, ride winners”. Do You know any successful market guru who says “cut your winners, ride your losers ?”

In conclusion, there is a reason casinos have gold, marble, paintings from masters and gamblers declare bankruptcy. Double down on losers and You will go broke. One more thing about probabilities, it’s not about if, it’s about when.

Conclusion
Size does matter in the markets. Not paying enough attention to position sizing has consequences that range from unpleasant volatility to certainty of ruin. Position sizing is not a glamorous topic, but in highly competitive sport, every little bit of edge counts

A powerful two step process to deal with the endowment effect: The game of two thirds, or how to deal with free loaders in your portfolio

Would You allow tenants to stay rent-free ?

Would You allow tenants to stay rent-free ?

If You were the owner of an apartment building, would You allow tenants to stay rent-free forever ? You would probably do everything in your power to either collect or evict free loaders. In the investment realm however, one of the main reasons managers fail to accomplish their goals is that they allow free-loaders to stay rent-free in their portfolios. The difficulty then is how to identify and deal with free loaders.

They don’t really stand out enough on an individual basis. Yet, as an aggregate free-loaders put a drag on performance.

  • Endowment effect: once in the portfolio positions are sticky.
  • How to identify and effectively deal with free loaders
  • The 3 main benefits of the game of two thirds
Once upon a time, i used to place thematic small positions across the portfolio like pawns on a chessboard. They were supposedly hedges for China, precious metals, oil, monetary intervention etc. They were all tiny positions that were supposed to kick in if any of these themes were to gain traction. Six months went by and I could not understand why performance was so pedestrian. Meanwhile, none of those stocks had worked. Then, it dawned upon me that even though they were tiny individual positions, they totaled 10% of the portfolio as an aggregate.
The endowment effect (Thaler 1980)
Endowment effect is the hypothesis that people value more what they own than what they could buy. It is hard for positions to dribble their way into our portfolios, but once in they become sticky. It is difficult to get rid of them, even though they do not contribute. Some managers would hold on to losers just because they do not know what to buy next.
Our lives, our desks, our houses are filled with clutter. Unless we actively create and enforce rules to get rid of it, clutter creeps up on us. Our inner saboteur will always find good reasons to hoard junk. To illustrate its potency, let’s look at a simple example: in your wardrobe, isolate the clothes You have not worn for over a year. Think about all the excuses to keep them, but then ask yourself: “If i did not have it, would i buy it now ?” If not, then bye bye, fashion moves on and so should You.
The game of two thirds: A simple two-step process to deal with free loaders
Free loaders neither detract nor contribute enough to be visible. They don’t stand out enough to be dealt with. Since it is not possible to deal with them on the y-axis (price), the solution is to introduce time x-axis. Rationale is simple, if stocks have been there for some time, but still fail to contribute, then their weight should be reduced.
  1. Calculate portfolio turnover, divide it by three: first 1/3. Add 1/3 turnover to the entry date of each position. For example, a stock entered on January 5th and a turnover of 1 would yield a cut-off date of April 5th
  2. Divide performance in 4 quartiles, concentrate on the third quartile: second 1/3. For all stocks in the third quartile past their anniversary date, cut weight in half
 Special mention for long-term winners
Apple (AAPL) or Softbank (9984:JT) are long-term winners. They sometimes go through extended periods of under-performance. Because there is so much embedded profit, it is difficult to realise that they have not contributed for some time. The idea then is to reset contribution on a rolling basis.
The idea then is to apply the same rules as above on a rolling basis. Instead of cutting positions to half, taking a portion the size of the out-performance from the previous haircut. For example, if Apple went up by 10% from previous haircut, then shave 10% off the current size.
The rationale is
  1. if it starts to underperform, it will be dealt with, and this profit taking will have cushioned the blow. This demonstrates stewardship
  2. If it continues to go nowehere, resources are re-allocated to a potentially more productive asset. If non-performance persists over 2/3 of portfolio turnover, then a more drastic reduction is in order
  3. if outperformance resumes, then it will be dealt with
It is important to periodically reset contribution. When stocks have been in the portfolio for a long time and substantially contributed, we become attached. Failure to reset contribution is one of the reasons why some managers escort their positions on the way up and then all the way back down. It doesn’t show until it is too late.
The three benefits of the game of two thirds

The game of two thirds may appear simplistic. It has however powerful psychological implications. It is a simple, powerful and objective way to short-circuit the endowment effect for three reasons:

  1. Simplicity: math is beyond dispute. Simple rules are elegant, easier to implement and harder to challenge
  2. Stewardship: great investors are not smarter, they have smarter trading habits. Getting rid free loaders builds the habit of dealing with difficult stocks
  3. The quality of our excuses determines the quality of our performance: one of the most frequent excuses is “what do i buy next ?” Constant re-examination of positions forces managers into action.
Discussion
Once in a portfolio, positions are often sticky. Asking ourselves “would you buy it again today ?” is too subjective to deal with positions that have overstayed their welcome. Our inner saboteur will find good reasons to procrastinate until the next review. Our natural instinct to hoard junk “endowment effect”. The game of two thirds is an elegant way to identify and deal with free loaders.


The game of two halves: an elegant two-step process designed to cut losers, run winners, while maintaining conviction

In every hospital around the world, there is an unwritten rule: surgeons should not operate on their own children. There is no such thing as professional detachment when it comes to your own child. In the investment realm however, market participants are consistently asked to defend their convictions, but also expected to be surgical about their losers. How can someone maintain enough attachment to weather rough times, but stay detached enough to surgically cut when necessary ?

“Cut your losers, run your winners” is the key to survival in the markets, but no-one tells You how to pick the lock. This is especially difficult if You are a fundamentalist (fundamental analyst/manager/investor/trader). First, there is no price mechanism like a stop loss to tell You it’s time to move on. Second, You don’t want to be perceived as lacking conviction. Third, investors want You to manage risk. No wonder 80% of managers find it difficult to outperform every year.
This is the second article in a series of four about exits and affective neurosciences. Our central premise is that the quality of exits will determine the quality of performance. The purpose of this exercise is to help fundamentalists cut their losers, run their winners, while keeping conviction. It is based on the assumption that they are refractory to the idea of a stop loss policy. It is a simple yet powerful method that is guaranteed to mechanically lift performance.
You do not need to be right 51% in order to make money
One of the classic myth is that “You will make money as long as You are right 51% of the time”. Wrong. You will make money only if You have a trading edge:
                     Trading edge = Average Win% * Win% – |Average Loss%| * Loss %
Let’s take an easy example: if average profit is twice as big as average loss, what would be the break-even hit ratio ?
          0  = 2 * X – 1 *(1-X)
          X     = 1/3
with X = Win% and Loss% = 1- Win%
In a system with a 2/1 profit/loss ratio, you only need to be right 1/3 of the time. In other words, stock pickers who identify 3-5 baggers only need to keep losers small to make formidable gains
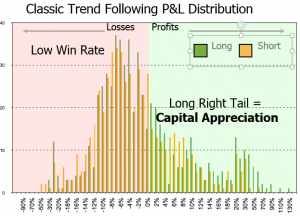
In reality, the visual representation of a stock picker’s P&L distribution looks very much like the chart below: a few princes make up for a lot of frogs. . Being right 51% of the time through the entire bull/bear cycle is the unicorn of stock picking. Every strategy experiences a drawdown at some point. Stock pickers make money as long as they stay disciplined and keep their losses small.
 Gain Expectancy - Classic Trend Following
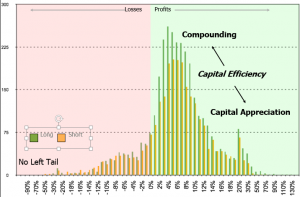
 In order to move to the distribution shown below,  one of two things need to happen:
  1. Either reduce the number of frogs: easier said than done, particularly when strategies stop working at some point through the cycle
  2. or, their impact is reduced: reducing drag will mechanically improve profitability
 Gain Expectancy - Alpha Secure
Predicting tomorrow’s winners is much harder than dealing with today’s losses. The game outlined below is an elegant way to deal with losers. Not only does it mechanically improve the trading edge, it also salvages ego and rewires neural pathways from outcome to process orientation.
The game of 2 halves
The objective is to halve the weight of losers once they detract more than half average contribution. Proceeds are then re-allocated to either fresh ideas or winners. This is a simple two-step process:
  1. Divide all positions between contributors and detractors, calculate average contribution: first half
  2. Reduce weight by half (1/2) for all detractors below -1/2*Average contribution: second half
Example:
Average contribution: +0.5%          Babylon Ltd weight: 4%  Unrealised P&L: -0.4%     Realised P&L: 0%
After weight reduction                      Babylon Ltd weight: 2%   Unrealised P&L: -0.2%     Realised P&L: -0.2%
Now two things will happen: either Babylon Ltd will perish, or it will rise
  1. If Babylon meets a tragically eponymous fate : it would have to drop another -15%, just to reach minus average contribution, or -0.5%. At this point, it will be either it is a screaming Buy or a dog. Either way, it will be an easier decision to make
  2. If Babylon rises: then unrealised profits will compensate for realised losses. One rule of thumb in order to maintain a positive trading edge, do not add to the position until it crosses previous entry price
The additional 2% freed-up can be re-allocated either to winners or fresh ideas. Adding to winners cements conviction. Adding fresh ideas brings fresh blood to the portfolio. Either way, it is more of a good thing.
Special mention for managers who use an equal weight position sizing: Equal weight position has many drawbacks, but it has one benefit in this case. Instead of using contribution (weight * return), a simple distribution of return is sufficient.
The game of two halves has three deep benefits
  1. Trading edge mechanically improves: this is a simple elegant formulation of the first mantra: “cuts your losers and ride your winners”
  2. Good stewardship: managers are often torn between defending their convictions and dealing with problems. If they cut too frequently, they are perceived as lacking conviction, which negatively impacts investors confidence. By selling a portion of the position, they show peers and investors that they both maintain their conviction and deal with problems
  3. Process versus outcome neural pathways re-wiring: funds reach capacity not when they are too big in size, but when inertia sets in. Dealing with losers forces managers into action. This accomplishes three things:
    1. Managers become dispassionate with their problem children: since dealing with them improves stewardship, the stigma of taking a loss disappears. The game is simple enough to be executed even in the darkest
    2. Increased fluidity: since proceeds are re-invested, managers have a direct incentive to look for fresh ideas, or to their existing ones
    3. Process versus outcome mindset: believing that being right about a stock is a matter of profitability is an outcome process. When ideas are profitable, ego gets validation. When (not if) they are unprofitable, ego feels under attack. This invariably leads to defensive, unprofitable and often destructive behaviors. Dealing with losers in an orderly fashion changes focus from outcome to process. Being right is no longer about the outcome but about doing the right thing.
Conclusion
The game of two halves is a key to unlock the “Cut losers and ride winners” fortress. It is an elegant solution to the oldest problem in fundamental investment. It reconciles the demand for conviction with the need for action. The privilege of its (mathematical) simplicity is that it imposes itself even in the darkest times.
More importantly, it changes the definition of being right. It is not a binary outcome on the profitability of individual ideas., It is the observance of a process that will lead to higher aggregate profitability. In the Jungian archetypes, it no longer triggers the orphan (amygdala in the limbic brain, responsible for fight, fight or freeze), but activates the ruler (pre-frontal cortex or thinking brain). In short, the game of two halves reduces stress and improves profitability.

Regardless of the Asset Class, There Are Only Two Types of Strategies

Finance is one industry where there is no shortage of creativity. There is always a new strategy, investment vehicle, or asset class. This alphabet soup is confusing, particularly when it comes to assessing risk and reward across asset classes. Yet, there is a simple universal way to classify strategies. They fall into two buckets: either mean reversion or trend following. Simply said, the exit policy determines the win rate, which then shapes the return distribution.

Summary

  • A powerful visual representation of style/gain expectancy: Call to Action: our commitment is to help people become better traders. if YOU want to visualise your style, opt-in and we will send YOU a portfolio diagnostic tool for free
  • Regardless of the asset class, there are only two types of strategies: mean reversion or trend following
  • Each strategy type has a specific risk profile, which require different risk metrics. Common Sense Ratio recaptures risk for all strategy types (Read this, it is important)
  • How to increase the win rate, gain expectancy and overall profitability depending on strategy type ?

I. The only two types of strategies: mean reversion or trend following

Over the years of patiently testing multiple algorithmic strategies, patterns in the return distribution repeated over and over. It eventually became apparent that strategies fall into two buckets: mean reversion or trend following. Attached are graphical representations of the gain expectancy of mean reversion and trend following strategies. The reason why the same patterns repeat themselves is simple: exit policy.

Market participants tend to treat exit as a single final event. Each trade is a binary event: either it is profitable or not. The accumulation shapes the return distribution. Hit ratio is then determined not by what we enter, but how we exit.

Charts below are return distributions for each strategy type. They are also visual representations of gain expectancy. One image speaks more than a thousand words. This representation changed my life. It permanently altered the way I perceive the markets. The game is about tilting gain expectancy: contain the left tail, moving the peak hit ratio to the right and elongating the right tail. This visual representation is a powerful tool. This is why we want to share it. We are committed to helping people build smarter trading habits. Sign-in to our newsletter (it’s free) and we will send you a portfolio diagnostic tool.

Mean reversion strategies compound small profits

Gain Expectancy - Classic Mean reversion

Death by knock-out: many small profits. a few knock-out blows

Mean reversion strategies compound multiple small profits. They rely on the premise that extremes eventually revert to the mean. They aim ato arbitraging small market inefficiencies. They often have low volatility  consistent performance. They perform well during established markets: bull, bear or sideways. They unfortunately perform poorly during regime changes. They also perform poorly during tail events. The key issue is to contain rare but devastating blow-ups.

 Mean reversion strategies characteristics are (see graphical representation):
  • Moderate to high turnover
  • High win rate: often above 50%. The shorter the duration, the higher the probability of success
  • Consistent small average profits: trades are closed around the mean
  • Low volatility consistent performance
  • Potentially devastating left tail losses: make a little bit of money every day and lose a fortune in one day
  • Long period of recovery after losses:
Examples of mean reversion strategies are
  • Short Gamma: sell OTM options so as to collect pennies in front of a steam roller
  • Pairs trading (non FX): bet on the convergence between two historically correlated securities
  • Value investing: Buy low PBR stocks and “undervalued” assets
  • Counter trend: sell short shooting stars and catch falling knives

Mean reversion strategies post modest but consistent profits. They cater to investors who would look for low volatility returns. Their challenge is the left tail, those infrequent big losses that will take a long time to recoup.

Trend following strategies have a few home-runs 
Gain Expectancy - Classic Trend Following

Death by a thousand cuts: many frogs, a few princes

Trend following strategies rely on the capital appreciation of a few big winners. Whether they follow stories, fundamentals, earnings or price momentum, stock pickers are trend followers. They may fail to appreciate being called trend followers, but their P&L distribution tells a different story.

Trend followers kiss a lot of frogs: they have a low hit ratio, often between 30% and 45%. Performance is cyclical. Styles come in and fall out of favor. Volatility is elevated. Performance can be underwhelming for long periods of time. The key issue is to contain losses during drawdowns.

 Trend following strategies share those common characteristics (see graphical representation):
  • Relatively low turnover
  • Low win rate: 30 to 40%: see chart
  • Big wins and lots of small losses: right tail on chart
  • Relatively higher volatility
  • Pronounced cyclicality: style comes in and goes out of favor
Example of trend following strategies are
  • CTA type systematic trend following,
  • Momentum: earnings momentum, news-flow, price momentum
  • GARP investing: growth at reasonable price
  • Buy & hope
 Trend following strategies post impressive but volatile performance. They can go through long periods of underwhelming performance, which take their toll on the emotional capital of managers. Their main challenge is to keep cumulative losses small. Profits only look big to the extent losses are kept small.
II. How to measure risk for each strategy type
Investors suffer from a “nice guy syndrome”: some young women genuinely say they want to marry a nice guy, but unconsciously react to so-called “bad boys”. Investors genuinely say they want returns, but in reality they do react to drawdowns. More specifically, they are susceptible to drawdowns in three ways:
  1. Magnitude: never lose more than what investors are willing to tolerate
  2. Frequency: lull investors to sleep. Clients will trade performance for low volatility: big money is fixed income, not stocks
  3. Period of recovery: never test the patience of investors.
There are two ways to lose a boxing match: either on points or by knock-out. Mean reversion strategies score until they get knocked out. Trend following strategies lose on points. Risk is not evenly distributed. Therefore, each strategy deserves its own set of risk metrics.
Risk metric for mean reversion strategies: knock-out
Knock-out

Knock-out

Mean reversion strategies have low volatility, consistent performance and high Sharpe ratio. On the surface, they are what investors look for. The problem is mean reverting strategies work well, until they don’t. Big losses are unpredictable. LTCM had a great Sharpe ratio, at least until October 15th, 1987… Risk is in the left tail. The best metric for mean reverting strategies is therefore: tail ratio. Tail ratio measures what happens at the ends of both tails:

Tail ratio  = percentile(returns, 95%) / percentile(returns, 5%)
For example, a ratio of 0.25 means that losses are four times as bad as profits. Turnover then becomes an important variable: the higher the turnover the shorter the period of recovery. The two ways a mean reversion strategy can survive is either by 1) containing the left tail or 2) increasing turnover.
Mean reversion strategies will test investors’ nerves on two things: magnitude of loss and period of recovery. For example,  some strategies such as fundamental pairs trading post constant, reassuring but modest profits like 0.5% a month. Then one day, they post losses of 3 to 5%. They lose in one month the gains of an entire year.
Investors often succumb to the sunk cost fallacy with mean reversion strategies. They believe that big losses are rare and that managers will eventually make them back. This bias ignores probabilities, particularly the theory of runs. It also ignores opportunity costs. The good news is that there is an optimal point below which it makes more sense to redeem than to stick with managers who experienced a severe loss. It is often referred to as optimal stopping. Whilst the formula can be complicated, a simple rule of thumb is to redeem if losses are below 0.4 of turnover.
On the other, trend following strategies have tail ratios ranging from 3 to 10. Winners are much bigger than losers. So, tail ratio is meaningless for trend followers.
Risk metric for trend following strategies: erosion
Trend following strategies have typically low win rates. Risk is therefore not in the tails, but in the aggregates: are a few winners big enough to compensate for the multitude of losers ? Measuring risk then boils down a simple ratio of profits over losses. The risk metric for trend following strategies is therefore:
Gain to Pain Ratio = Sum(profits) / Sum(losses)
Trend following strategies will test investors nerves on frequency of losses and period of recovery. Frequency of losses is another word for volatility. Trend following strategies are volatile, but semi-volatility (downside volatility) is low. They can also post lackluster performance for long periods. For example, mutual funds have built-in cyclicality. Even if they claim to beat the index, mutual funds still lose money during bear markets.
GPR does not apply to mean reversion strategies because blow-ups are unpredictable. GPR can stay high until it is torpedoed by one or two bad losses.
Combined risk metric: Common Sense Ratio
 
 “Common sense is not so common these days”, Voltaire, French freedom fighter
Managers rarely define themselves as adherents of either mean reversion or trend following. Even so, it still would not be easy to assess robustness. Besides, the more risk metrics we use, the more confusing it becomes. For example, some managers have great performance despite a bad Sharpe ratio, so the question is “which matters more in which context?”
Since both metrics outlined above can be expressed in a simple binary ratio, combining them makes sense. When this ratio was first to colleagues and friends in the HF world, comments sounded like “yep, common sense”, hence its imaginative name: Common Sense Ratio
                                                                     Common Sense Ratio = Tail ratio * Gain to Pain Ratio
                                                               Common Sense Ratio = [percentile(returns, 95%) * Sum(profits) ] / [percentile(returns, 5%) * Sum(losses)]
Above 1: make money, below 1: lose moneyCSR is much more powerful than either metric taken individually.
Example 1: GPR = 1.12, TR = 0.25, turnover = 2, CSR =  0.275
Let’s take a classic mean reversion strategy that generates 10% p.a. (GPR = 1.1). It has a moderate turnover of 1.5. Within a 24 months period, it will post a monthly drop of -4%, with a 95% probability. This is 5 times as big as the average profit, and roughly 4 times as bad as right tail profits (TR = 0.25). Common Sense Ratio is CSR = 0.25 *1.1 = 0.275.
On the surface, it may look like a modestly attractive strategy. In reality, the period of recovery combined with magnitude of loss imply that investors will have to be patient. In very simple terms, the CSR shows that returns are not attractive enough to justify investing in such strategies. Try this with a few low volatility strategies. Risk is not where You think it is.
Example 2: GPR = 0.98, TR = 3, turnover = 0.5, CSR = 2.94
Now, let’s take a strategy that loses 2% over a complete cycle (GPR = 0.98). Best winners are 3 times as big as worst losers (TR = 3). Turnover is low 0.5. You may think, why invest in a vehicle that loses money ? It does not make sense. Yet, You are invested in such vehicles: welcome to the average mutual fund. 80% of mutual funds lose roughly 2% to the benchmark. Every now and then, they outperform with a vengeance. The rest of the time they suck air. Morality: over time, mutual funds are poor investment vehicles if You stay invested through the cycle.
III. How to tilt the win rate, gain expectancy and overall profitability depending on your win rate
Gain Expectancy - Alpha SecureThe question boils down to: is it possible to combine the benefits of both strategy types without having the drawbacks of either one ? How can we generate a return distribution that would look like the one on the chart ? (*)
The whole game of investing is about generating a return distribution that would have the following characteristics:
  1. No left tail: small losses like a trend following strategy
  2. Long right tail: big wins like a trend following strategy
  3. High win rate: above 50% win rate like a mean reversion strategy

This type of strategy combines both short term compounding with long-term capital appreciation.

Investors following a mean reversion typically come in early and leave too early. The key is therefore to elongate the right tail. This is done through allowing a remainder to extend beyond the mean with a trailing stop loss.
  1. Set a stop loss (more on this in an upcoming article)
  2. When the trade means reverts, close half the position
  3. Set a trailing stop loss (not based on valuation) and close the trade once the stop loss is penetrated
Bottom line, markets can stay irrational longer than You think. When it stops making sense for You, it may start making sense for someone else. Ride their tail, but protect your downside.
If You are a trend follower, here is a simple game (game of 2 halves) that will mechanically improve your return distribution. We all know that making money is about cutting the losers and riding the winners. Here is an objective way to do it:
  1. Calculate your average contribution, divide it by 2
  2. Reduce by half every losing position below – half average contribution
  3. re-allocate the proceeds to winners
Bottom line, you have reduced losers and increased winners in a simple way (more in an upcoming article)
Conclusion
The  purpose of this article was to introduce a simple yet powerful way to reframe strategies independent of asset class. This enabled us to look at the merits and drawbacks of each type. We then looked at risk metrics that would best recapture their risk profile. We introduced a unified risk metric Common Sense Ratio that works across all asset classes. Finally, we looked at ways to tilt gain expectancy for each strategy type. Last but not least, if You want to know what your trading style, please subscribe and we will send You a diagnostic tool for free.
Preview of the next article:
The next article will deal with investor psychology. Short sellers have a unique perspective on investors psyche. We never sell short against buyers. We observe people who once held a position and are now processing grief. The next article will be about the psychology of grief adapted to the markets.
  1. Market regime: bear markets have several distinctive phases, with a measurable market signature
  2. You will never read an analyst report the same way again. You will learn to read emotions through language and back it up with numbers
  3. You will be better equipped to bottom fish for stocks
(*) : All above return distributions are derived from the same strategy. It has both mean reversion and trend following components. In order to draw a mean reversion strategy, the trend following component was switched off, and vice versa to build a TF distribution. Both components are normally switched on, third distribution