Convex position sizing algorithm: something your brain can trade through euphoria and depression
Introduction
There are two position sizes: too little or too much. Too little when it is working and too much when it is not. Of course, our inner idiot compels us to take too little risk when we should be bold and vice versa when we should be prudent.
Position sizing is this critical juncture between financial and emotional capital. Deplete the former and it will take effort to rebuild. It is a complicated problem, but not a complex one. Break the latter and “Game Over”.
On the short side, position sizing is even more critical: failures get bigger and painful, while successes shrink away. Over the years, I have experimented with many position sizing algorithms. Many of them were brilliant, but I would always drift away and abandon each one of them after a while. Then, I realised I looked at the problem from the wrong angle. Convex position sizing is the story of my journey
If You have encountered “fear of pulling the trigger” or if You routinely take too much/too little risk at precisely the wrong time, then this position sizing algorithm might be for You.
Part 1: The correct mathematical answer may not be the right one
The first part of the journey was to find out why I consistently drifted from conventional algorithms.
- Short selling is not a stock picking contest, it is a position sizing exercise
On the short side, the market does not cooperate:
- Volatility is elevated: that rules out systems like equal weight.
- Concentrated bets is a bad idea, as their volatility drives the short book and consequently the entire book
- Short squeezes are frequent: expect all shorts to rally >10% over 5 trading days
- During bear phases, correlation goes to 1. Expect Longs and Shorts to go against You at once
- Unprofitable trades balloon rapidly. So, the natural tendency is to be conservative and take small risks.
- Unlike the long side, there are no 2-3 baggers. Winners shrink and contribute less. So, there is an opposite tendency to oversize positions.
Bottom line: the short side is less a stock picking contest than a position sizing exercise. Winners get smaller and loser get bigger. The difficulty is to size positions so that they contribute when successful, but do not torpedo performance when unsuccessful.
- Two types of algorithms and two types of people
There are two types of position sizing algorithms: aggressive or conservative. Risk seeking systems will have You bet beyond your comfort zone, and sometimes lose more than You should. System failure means cumulative losses have permanently damaged your ability to bounce back.
Conservative systems will have You bet small and earn less than You could. Failure means returns are not attractive enough, and/or period of recovery after a big loss is too long.
There are also two types of people when it comes to risk: risk seeking or risk adverse. Risk seeking people have higher tolerance for the volatility that comes with bold choices. If they go too far, they may no longer have the resources to bounce back.
Risk adverse people accept underwhelming returns in exchange for low volatility. Their downfall is they are sometimes conservative to the point of being risk seeking. Failure does not mean they aim too high and miss their target. Failure means they aim too low and succeed.
- Regime Change, transition and drift
Now, the world is not Manichean. There are times when it is wise to be conservative, settle for a risk adverse system, accept to earn a little less than You could.
There are also times when it pays off to be aggressive, ride a risk seeking system, but potentially lose a lot more than You should.
The problem is that most position sizing algorithms are good at either one or the other. They are not equipped to transition smoothly from equity growth to capital preservation. A core principle is that systems must be followed throughout a cycle in order to achieve predicted results.
- The correct mathematical answer may not be the right one
The problem with many position sizing algorithms is not to find the optimal size that will achieve desired geometric returns. The difficulty is keeping executing through euphoria and depression. Of course, optimal f is the correct position sizing algorithm. The problem is my inner idiot thinks he knows better.
For example, “fear of pulling the trigger” is simply the inner idiot (often referred to as amygdala) saying those bets are too big. This fear gets reinforced after every loss in the thalamus. It eventually gets to the point where the brain overrides the algorithm, but rationalises decisions. Self-deception is insidious, it covers its own tracks.
I did not abandon any of the position sizing all at once. I just gradually drifted away. I failed because my inner idiot constantly second guessed what the algorithms suggested. Discipline is futile. It’s like diet: everyone puts those kilos back on in the end.
I therefore realised that the only way to makes more sense to build a position sizing algorithm that the brain can embrace and then figure out the math.
Part 2: Convex position sizing
- Philosophy of the convex position sizing
Convex position sizing algorithm was conceived backward. Math is subservient to the brain. It may not be the optimal mathematical solution, but it is one my inner idiot will have no problem executing during triumph and disaster.
So, I started out with a list of demands
- Trade at optimum risk: (accelerator)
- Accelerate to maximum risk during run-ups, but
- Decelerate quickly as soon as there is a drawdown
- Absorb volatility: (brakes)
- allocate maximum equity, but
- reduce risk drastically during severe drawdowns
- Avoid whipsaws due to premature re-acceleration
- Reduce risk for each new re-entry: (trend maturity)
- Simple input variables (risk appetite)
The best analogy is fuel efficiency. Flooring the accelerator and then slamming the brakes is not a fuel efficient way to drive. These are aggressive systems like Kelly criterion, optimal f and Fixed Ratio Position Sizing (FRPS). Driving like Mrs Daisy is lovely, but not necessarily the most competitive style. These are systems like constant Fixed Fractional Position Sizing (FFPS), equal weight.
Convex position sizing algorithm runs at optimum acceleration. It will take on risk as equity curves rises and reduce as it comes down. It will slam the brakes to avert accidents and then re-accelerate smoothly. Risk Per Trade is the accelerator and Equity would be the brakes.
One of the strengths of the algorithm is smooth transition from risk seeking to risk adverse. The algorithm focuses on drawdowns. As soon as there is a drawdown, risk is reduced. Conventional position sizing algorithms focus on winning streaks and thresholds. They are therefore slow to react.
- Fixed Fractional Position Sizing revisited
Fixed Fractional Position Sizing algorithm basic formula is:
Market Value = Risk Per Trade / Distance to Stop Loss * Equity
Most formulas focus exclusively on Risk Per Trade (RPT). With the notable exception of Market’s Money, few of them consider Equity (capital allocation or surface). The idea became clear to use both sides, one for acceleration, the other for deceleration.
- Convex Risk Per Trade
In practice, this is what Risk per trade looks like:
Risk per trade oscillates between a minimum and maximum. Trends mature, so risk per trade is reduced for each re-entry. Convexity comes from the ratio of min/max risk. In this example, min risk is set at -0.25% and max risk at -1%. The bigger the ratio the steeper the acceleration.
How to calculate min and max risk per trade
- Max Risk per Trade: Risk Appetite / [AVG number of positions * (Long Term Loss Rate + 2 STDEV(Loss Rate)]
- Risk appetite: is not a mathematical number. It is the drawdown investors are willing to stomach before redeeming. Whatever You think that number is, divide it by 2. This is a clear case where You do not want to be right !!!
- Long Term Loss Rate: ideally, this is the win rate through the entire cycle. When there is not enough sample data, default to a conservative 2/3. That means 2 trades out 3 will fail. 51% Win rate is for fairy tales, and Prince charming is not coming
- Min Risk per Trade: this is the minimum RPT that would still allow trading during drawdowns
- Position count: Trends mature. Risk should therefore be reduced after each entry so as to avoid giving back profit on last entries
Risk appetite is one of the two input variable of the entire posSizer algo. Everything else is calculated.
- Drawdon module
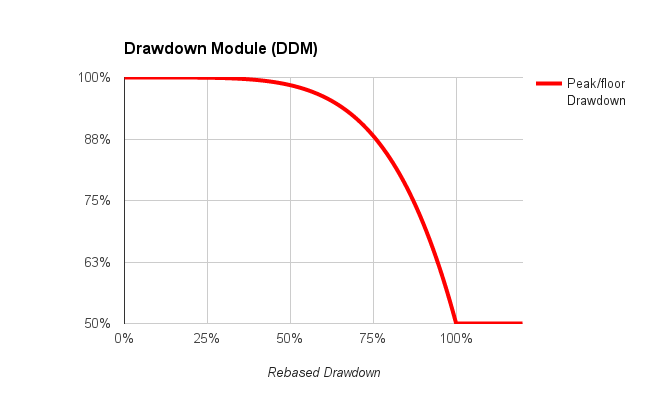 This is the equity allocated to each trade. The objective of this component is to absorb small daily volatility. As a drawdown becomes severe, surface is exponentially reduced so as to collapse residual risk. Note the slope of the curve. Small recovery results in rapid increase of the surface.
Trading floor: this is the second input variable. This is a percentage of equity balance that will be allocated if drawdown exceeds tolerance. A good example here is Millennium partners. After a drawdown of 5%, equity is automatically reduced to 50% of initial capital.
When investors say they can stomach a 20% drawdown, what they mean is they will think about redeeming after a 10% drawdown. So, it is wise to cushion the blow with this drawdown module.
Part 3: Convex position sizing in action
This posSizer runs on auto-trade Metatrader MT4. We trade closer to 30 currency pairs, leveraged at 100:1 on 15 minutes periodicity. This is probably as aggressive as it can be.
It feels like being in a driverless Formula 1, without a steering wheel, pedals for accelerator and brakes. Yet, thanks to this algo, there is no need to stay glued to a screen all day. This posSizer provides priceless comfort when most needed. It will smoothly handle trouble: reduce risk, collapse it if necessary and then re-accelerate rapidly.
This is what it looks like in practice. Below is a hypothetical equity curve (GS stock price). The real equity curve does not have those big drawdowns, so it is harder to distinguish.
Blue and pink lines are min and max market values per trade (MVPT). Green lines are market values for each position n1 to n4. Orange line is first entry without the drawdown module.
As equity curve rises, MVPT rises in unison. MVPT reacts rapidly to each drawdown but still remains closer to the upper bound until a more pronounced drawdown happens. Risk is reduced for each new tranche.
The drawdown module kicks in during severe drawdowns. This is the difference between the orange and green dotted line. MVPT goes down even further than minimum risk. There are times when even small positions seem too big. This ensures trades go through but at bare minimum risk. This reduces concentration, which in turn sets the stage for a rebound.
One of the problems of FFPS is premature re-acceleration after a drawdown. This leads to whipsaw in sideways markets. This is again a potential reason to drift from suggested positions. After a severe drawdown, the orange line rises faster, while the dotted line adjust re-acceleration to the speed of recovery. For example, the first drop below min risk was followed by a prompt recovery. The second one was more gradual.
Conclusion:
Under extreme stress, every degree of freedom, every bit left to interpretation has the potential for costly human error.
Position sizing often overlook the most important component in any trading system: our inner idiot. This algorithm reconciles math and affective neurosciences. It helps us “meet with Triumph and Disaster, and treat those two impostors just the same”, extract from Rudyard Kipling, “If”
Great article. Thanks for the more in depth explanation. I hope to do some of my research based on this idea.
Thank You very much Derek
Input variables are:
Risk appetite: how much are clients willing to stomach before they redeem ? Divide by 2
Trading Floor: During severe drawdown, how much capital should be allocated ? For example: when nothing seems to work, should You trade at 50% of your potential, 2/3 etc ?
Equity curve oscillator: just a 0-1 oscillator between peak and min equity
Kind regards,
Laurent
Hi Laurent,
Great job here. I’ve only recently came across your website via Quora. Apart from the fact that your articles make a lot of sense, they are lighthearted and enjoyable to read.
As you have stated above, extreme stress will visit each trader, it’s just a matter of how frequently it occurs. Bet size is obviously related to this as it leads to the quantity of and severity of the stress we feel during the course of our trading.
It’s great to understand that given a bit of research there’s a lot we can do to mitigate this and other emotional risks to stay in the game long term. In my case, more recently, the development of my emotional understanding is helping me a great deal, both in and out of trading.
For me, controlling my position size leads to better emotional experience post execution of trades. I do this via an anti-martingale strategy which reduces my bet size considerably after 2 consecutive losses, and each loss thereafter.
I like the consideration you have given to this position sizing formula, in that recognition of trends is acknowledged. I’ve used this in my own trading for a while. Ed Seykota is an interesting character, a bit crazy, like the rest of us in some way! Seriously though, he has some interesting comments on this;
“Pyramiding instructions appear on dollar bills. Add smaller and smaller amounts on the way up. Keep your eye open at the top”
but he also gives warnings about it as well, in that discretion can be used which, as we all know is asking for trouble in terms of interpretation. This can lead to over trading and illogical position sizing.
Personally I don’t have issues with “discretion” or “over trading”whilst scaling in or out, it’s systematic. But I do take his advise on about the instructions provided on dollar bills, ie less and less position sizing, glad to see you do too.
As a newbie in my early 20’s, I started trading with sweet F*** all (knowledge and money) but nonetheless I would still only bet what I could afford to loose. This was a blessing really, insofar as the size of my equity meant that my position sizing was pre-determined in a large part by those factors. The result of which was that I was able to stay in the game long enough to pick up and learn good habits.
Those of us who are the best at managing loosing trades will achieve our goal of peak performance on the upside as well as the mitigate the downside. It’s all about staying in the game, understanding / accepting / leaning that about what is in our control and more importantly, what is NOT.
Thank you for helping me with my trading development.
Dex-fx
Hi Laurent,
Great job here. I’ve only recently came across your website via Quora. Apart from the fact that your articles make a lot of sense, they are lighthearted and enjoyable to read.
As you have stated above, extreme stress will visit each trader, it’s just a matter of how frequently it occurs. Bet size is obviously related to this as it leads to the quantity of and severity of the stress we feel during the course of our trading.
It’s great to understand that given a bit of research there’s a lot we can do to mitigate this and other emotional risks to stay in the game long term. In my case, more recently, the development of my emotional understanding is helping me a great deal, both in and out of trading.
For me, controlling my position size leads to better emotional experience post execution of trades. I do this via an anti-martingale strategy which reduces my bet size considerably after 2 consecutive losses, and each loss thereafter.
I like the consideration you have given to this position sizing formula, in that recognition of trends is acknowledged. I’ve used this in my own trading for a while. Ed Seykota has some interesting comments on this;
“Pyramiding instructions appear on dollar bills. Add smaller and smaller amounts on the way up. Keep your eye open at the top”
but he also gives warnings about it as well, in that discretion can be used which, as we all know is asking for trouble in terms of interpretation. This can lead to over trading and illogical position sizing.
Personally I don’t have issues with “discretion” or “over trading”whilst scaling in or out, it’s systematic. But I do take his advise on about the instructions provided on dollar bills, ie less and less position sizing, glad to see you do.
Those of us who are the best at managing loosing trades will achieve our goal of peak performance on the upside as well as mitigate drawdown on the downside. It’s all about staying in the game, understanding / accepting / leaning that about what is in OUR control and this why your formula is relevant.
Thank you for helping me with my trading development.
Dex-fx
Hello Dex-fx,
Thank You very much for your comment. I really like the $ bill pyramid analogy. Thank You.
Your 2 stop loss risk-off was inspirational. Great idea.
Thank You very much
Hello Laurent:
I’ve been following your blog and posts on Quora and working on a small trading system. I was wondering if you could answer a question on position sizing. One of your articles suggests that the Convex position sizing approach would lead to higher returns (end equity) using the same strategy as compared to a fixed % risk model.
I have been trying to research into using a fixed % risk model vs a “reverse martingale” convex model (decreasing one’s bet when one’s equity decreases) and I’m unable to obtain a higher equity curve at the same risk budget (e.g. 1%) . However, the convex model does have a lower drawdown.
I’m intrigued by how “Secure f” convex model is able to outperform a fixed 4% equity model, but I’m not sure what is the max risk budget behind this line (is greater than 4% of equity? Or could it be due to the scaling in and out of positions (n1-n4)?
Also, I was wondering if Volatility-based position sizing (Sizing positions based on an instrument’s volatility (not stops) and assigning a fixed % equity to determine lot size), and does it perform better in the long run compared to Percent risk based models?
Thanks for your insights and informative articles!
Regards,
Kenny
Hello Kenny
I have merged the question You asked by e-mail and your comment. The answer on e-mail is at the end of th
Thank You very much for your questions. It is a pleasure answering sophisticated people like yourself.
fixed % risk model vs a “reverse martingale” convex model (decreasing one’s bet when one’s equity decreases) and I’m unable to obtain a higher equity curve at the same risk budget (e.g. 1%) . However, the convex model does have a lower drawdown.
I don’t have enough elements to bring a definitive answer. Here are the problems i faced: 1) too small a position size and it cannot contribute enough to absorb losses. There is a minimum risk below which bet size is too small to work. Our Minimum risk is -0.50% 2) re-acceleration after a losing streak: reverse martingale is a fancy way of saying bet smaller when losing. The problem we faced was re-acceleration after a drawdown. Solution: we calculate everything of the peak equity. 3) carrot and stick: we have introduced a penalty/reward system. Toxic pairs (EURUSD, EURTRY, EURAUD etc) start off with lower risk per trade and then as they prove themselves through multiple re-entries and partial exits, penalties are reduced. This naturally rewards good behaviour and mitigates of poorly performing securities. Even though it may not seem related to your question, this penalty/reward system works well on scale-out/scale-in systems
As for our convex position sizing algorithm, we have not decided whether we want to commericalise it. Even though i am a believer in open source, i do not believe that open source position sizing will give it the respect it deserves. I strongly believe that position sizing algos are as much if not more valuable than strategies themselves. Example: look at breakout strategies turtle style. It would be worth nothing i-e negative gain expectancy w/o proper money management
I’m intrigued by how “Secure f” convex model is able to outperform a fixed 4% equity model, but I’m not sure what is the max risk budget behind this line (is greater than 4% of equity? Or could it be due to the scaling in and out of positions (n1-n4)?
Equal weight 4% is already a big size position. Many suggested sizes under our algo are near or smaller than 4% per our risk budget. The question then is more about buying power and volatility of performance for low correlated securities. 4% equal weight caps concentration at 50ish positions on 1 time leverage. Maybe it is enough, maybe not. It certainly has higher performance volatility profile. That is question You should ask your investors actually.
Now, if You use a pairs strategy 4% on each side makes sense as performance is derived from the delta of both securities. Deltas are usually not that big, so bigger sizes magnifies returns. Pairs trading strategies have higher leverage 200% and above precisely to magnify otherwise underwhelming returns.
My issue with pairs strategy is regime change. Pairs strategies give back a lot of performance when markets rotate. Example: later bear to early bull. Usually small caps and speculative stuff rallies hard while quality stuff underperforms. Mean reversion stops working during regime change. As long as You are aware of that and do not try to trade yourself out of a hole but reduce leverage instead, then transitions can be negotiated fairly well. Does it make sense ?
Also, I was wondering if Volatility-based position sizing (Sizing positions based on an instrument’s volatility (not stops) and assigning a fixed % equity to determine lot size), and does it perform better in the long run compared to Percent risk based models?
Do You mean stop loss does not incorporate volatility, so a straight volatility based position sizing based on realised vol ? I don’t know to be honest. The thought never crossed my mind
Exeprt of an e-mail exchange
You mentioned that scaling in and out (Reduce position by half) can help to improve distribution returns.
In this scenario:
1) If I assume that a trading strategy has a certain edge / profitable (under a fixed 1 lot backtest) , does scaling in and out improve that edge ? or does it reduce returns (and lower drawdowns)?
You are testing the win rate of your signal under a fixed 1 lot backtest
Trading edge = gain expectancy = Win% *Avg Win% -Loss% * Avg Loss%
If you go to the race horses and bet a single dollar on all horses, all you will have is average performance.
Very few systems have natural high win rates. Those which do often have catastrophic losses, i-e LTCM. So, the secret is to milk the winners and starve the losers. The problem is not true negative, but false positives or near wins. The way to turn around a system is to move the peak number of trades from false positives to positives, or from nears wins to misses. If you come ahead however small, your equity curve goes up, that is the secret. And this is achieved by scaling out and scaling in, so as to reduce false positives as well as proper money management
Scaling in is adding 1 unit to a position. Scaling out is taking 1 or more.
The problem with testing for signal is that it will not give you the depth of information you will need in real life. Sometimes, you want to invest but have no buying power. Sometimes you have too much cash. More importantly, all systems hit losing streaks at one point. Signal processing will not tell you how deep the hole will be.
Example: on Forex, we continue to spend the vast majority of our time on money management. Our game is to reduce drawdowns, through mitigating the impact of false positives. This is a pure money management issue that cannot be solved through better entry or exit. We trade 26 pairs and some of them are notoriously difficult: EURTRY, AUDCAD, EURUSD (one of the worst actually). We mitigate their toxicity via intelligent penalty systems.
This has important consequences on the drawdowns. For example, one of our trader has given back -6% since Brexit. The other system has given back -3%. Second system is now outperforming the first one with +27% since Brexit. I know it is not great, but we are working on it. We have some cool improvements in the pipeline
2) Reduce position by 50% (Is there a reason you picked 50%? Why not 70%?) Is this a value you optimised and backtested for a strategy or is there a mathematical reasoning behind this value?
Correct formula for break-even is: (cost- stop loss)/(price – stop loss)
The idea of how much to take off the table is novel for a lot of people, so start easy with 50%. In our Forex MT4 autotrade, we have perfected the above formula such that exit is not a technical analysis trigger, it is a money management green light, that also is novel
Yes I optimised it a long time ago, but I remain cautious about over-optimisation and backtest.