The Trading Edge Visualiser User’s Manual
It is impossible to survive in the markets without an edge. Let alone being able to quantify it. How do You know if You even have an edge ? If You want to articulate a better strategy, You need to 1) understand where your trading edge comes from, 2) quantify it and then 3) gradually improve it. Sharpe, Sortino or Treynor ratios may provide some comfort, but these are just sterile numbers. The smoothie approach of blending indicators and factors into an optimiser has never led to robust breakthroughs. Our brain remembers stories, associates images and concepts. If You can visualise your trading edge, quantify then You will be able to will be able to a better strategy.
The tool I am about to share simply changed my life. It permanently changed the way I approach markets and strategy development. It enabled me to reclassify strategies in two buckets. It then enabled me to understand the pros and cons of each. From there, it showed me the way to improve my trading edge by gradually nudging the distribution. This file is still very much part of my daily development kit. For example, in the summer of 2015 we realised there were many false positives very close to the break even line. We modified just 2 lines in the program, win rate improved by 5% points. This has enabled us to trade higher periodicity while keeping a high win rate.
The Trading Edge Visualiser tool is free. (You may be asked to reconfirm your mail-address, but it is 100% free). It is designed to be simple and intuitive. It will help You
- visualise your dominant trading style: mean reversion or trend following
- visualise and quantify your trading edge both in aggregate and at individual security level
- materially improve your trading edge: we posted some techniques and tips. Try them and see the results for yourself
The trading edge formula
Whatever You believe your trading edge comes from, it can be expressed in this simple formula
Trading Edge = Win% * Avg Win – Loss% * Avg Loss
The Trading Edge Visualiser is a visual representation of the trading edge. It shows two distributions: absolute P&L and contribution. Contribution is simply P&L divided by Equity.
Green and Orange bars show Buy and Sell (Long & Short) trades. Blue and mauve bars show AVG win, AVG Loss for BUY & SELL. The middle bar is BUY & SELL Trading Edge.
Visual representations of the trading edge of the styles
Irrespective of instruments traded, there are only two major types of strategies: mean reversion or trend following.
Mean reversion

Mean reversion strategies have a Moby Dick shape like distribution:
- the hump of the win rate is above the 50% hit ratio line
- The long left tail looks like a fin.
Trend Following
 Trend following strategies have those characteristics
- Low win rates: between 30 to 40%. The peak of the loss rate is below the 50% line
- Short left tail
- Long right tail
Step 1: Diagnostic
“If You don’t know who You are, the markets are a very expensive place to find out”, Adam Smith
Both Abebe Bikila, the barefoot Ethiopian marathonian, and Hussain Bolt run fast. Yet, marathonians are not good sprinters and vice versa. Similarly, we all have our own trading personality.
The story we tell ourselves about our style and what our trading history shows are two separate things. It is not uncommon to find “value” guys chasing momentum. Neither is it rare to find “momentum” guys doubling down on “cheap” stocks. The first step is to take an honest look at your dominant style. This tool is as honest as the scale in your bathroom.
Process your trading history on the Trading Edge Visualiser. Compare your distribution with the above major dominant styles: mean reversion or trend following.
Step 2: Understand and measure the risks associated with your dominant style
Risk is not a dissertation in an investment thesis. Risk is a number. The difficulty is to pick the formula will adequately match the risk associated with your style.
Sharpe, Treynor et al do not measure risk. They measure volatility of returns and naively assimilate volatility with risk. They may have some marginal utility for asset allocation purposes, but certainly not when it comes to quantifying risk.
Relevant risk measures:
- Mean reversion: The key risk measure for mean reversion strategies is the Tail Ratio. Tail ratios of 0.3 and below present severe risk of blow-ups. For example, some strategies may clock +0.5% every month, but have a sudden -4% drawdown. This would take 8 months to recover, which is probably beyond the patience threshold of many investors.
- Trend following: The key risk measure for trend following strategies is the Gain to Pain Ratio: trend following strategies have low win rates. For example, if You allow each loser to dent your capital by -1%, assuming a 40% win rate, winners will have to average +1.5% just to break even.
Common Sense Ratio
“Common sense is not so common these days”, Voltaire, French freedom fighter
One fine Monday morning at 9 am, I had the honour to meet Jack Schwager. I had just finished his book on risk so I was eager to show him my concocted risk measure. He murmured: “hmm, common sense”. A few days later, I showed it to my boss who cared to elaborate: “hmm, it makes good common sense”. Voila: Common Sense Ratio.
CSR = Tail Ratio * Gain to Pain Ratio
Lose money 1 < CSR < 1 Make money
CSR is a notable improvement on the tail ratio as it will also capture aggregate profit ratio, or the ability to recover from big losses. It will recapture the inherent cyclicality of trend following strategies via mediocre GPR but high tail ratio.
Step 3: Improve your trading edge
Techniques explained below are designed to nudge the shape of your distribution. Your trading edge is the shape of your distribution. Ideally, You want something that looks like this:
- High win rate: not only does it feel better, but it compounds faster
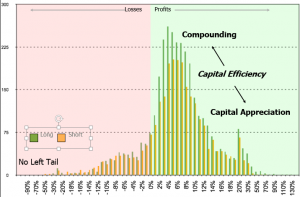
- Long right tail: ride your winners and allow your capital to appreciate
- No left tail: cut your losers
- Symmetrical distribution on the Long & Short side: identical rules on both sides of the book

Mean reversion
The key to success for mean reversion strategies is to increase the tail ratio. This can be accomplished in two ways:
- Stop loss: a strategy without a stop loss is like a car without brakes. As a rule of thumb, a stop loss should not be further away then twice the 90th percentile of your profits. Beyond that limit, the period of recovery may be too long to be commercially acceptable
- Elongate your right tail: mean reversion strategies do not allow winners to fully mature. This simple technique can allow winners to develop while preserving profits. Instead of closing the entire position, close no more than 2/3 and place a trailing technical stop loss on the remainder. Do not place a valuation stop loss as it will exceed your comfort zone.
Moral of the story:
- Shops do not restock on products they cannot sell; they mark down the inventory and clear it at a discount. Similarly, do not double down on losers, accept your loss and move on.
- “Value” investors usually sell their positions to their “momentum” colleagues, only to sigh in despair when prices subsequently double or triple. Next time, sell them a portion of your holdings and enjoy the ride with them. Worse case scenario, if it does not work, your stop loss will take you out and protect your profit.
Trend Following
Profits look big only to the extent that losses are kept small. So, all You have to do is to manage losses and profits will take care of themselves.
- Stop Loss is the second most important variable in your trading system, after the most volatile place on the market, that is the grey box between your left and right earlobes. Stop loss has a direct impact on three out of four components of the trading edge: Win rate, Avg Win, Loss rate. Make a habit of placing your stop loss as your enter your orders
- Would You allow tenants to stay rent free in a building You own ? Every time You say yes to a free loader, You say no to a good customer, so make a habit of evicting poor performers
- Improve your win rate: assuming average loss stays the same, any improvement in the win rate will have a material impact on the trading edge.
Real life example: i am a short seller. The short side is plagued by periodic tidal waves called short squeezes. The Trading Edge Visualiser taught me that rather fighting them, it made more sense to use them. I wait for the short squeeze to pass and only after that do I enter at a higher level. Then, as the next short squeeze approaches, I reduce size. This clocks a small win, reduces risk and allows to weather squeezes. Once the squeeze is over, there is a fresh high probability entry point.
This habit of scaling-out and scaling-in tilts the P&L distribution to something like the distribution at the beginner of the paragraph. It combines the high win rate of mean reversion strategies but still has long right tail, short left tail.
File user’s manual
The Trading Edge Visualiser was built using Metatrader 4 OrderLog. It can be applied to any trading history, provided You load data in the fields coloured in blue and reset the pivot table
Data load
- Time and Date: the information is organised in chronological order on the Table sheet
- Ticket No: this assumes that all trades have a unique identifier
- Symbol: The table sheet calculates the trading edge of each security in a timely manner
- Type: Buy/Sell, this allows rapid sort
- Buy/Sell Lots: this field is useful for multiple entries/exits
- Profit: this is an absolute USD P&L
- Contribution: this is a simple P&L / Contribution field. There is no currency conversion, benchmarking or modified-Dietz time-series. Relative performance calculation should take place in this field
Pivot Table settings
- ROW fields in Tabular Form: In the PivotTableFields: click on Field Settings: in Layout & Print table: Click on Show items in tabular form
- ROW Fields SubTotals deactivated: In the PivotTableFields: click on Field Settings: SubTotal & Filters table, Subtotals: click None
- PivotTable Options Totals Columns deactivated: Right-click anywhere in the PivotTable, go to Totals & Filters, uncheck Show grand totals for columns
- Column Label: Click on Select All to allow automatic refreshing
Useful tips:
- Run this analysis periodically and keep track of your evolution to receive the full benefits
- Truncate data: the current file looks at the entire population. Segment your trading history into blocks when your strategy performs, when it does not.
- Comment and annotate entries/exits. You will realise that a bit of finesse on exit will go a long way. It is useful to keep track of exits
Conclusion
People who keep track of their weight are 30% more susceptible to reach their weight loss target. The Trading Edge Visualiser tool will help You understand who You really are. It has the potential to transform your trading game, as it continues to do so for me.
It is 100% free, so download and play with it!
Hi I have recently downloaded the Visualiser. Thank you for the great tool.
However I am trying to understand your contribution calculations.
Contribution: this is a simple P&L / Contribution field. There is no currency conversion, benchmarking or modified-Dietz time-series. Relative performance calculation should take place in this field
I was unable to find a Contribution field. Would you be able to walk me through this calculation. I tried to figure it out in the EXCEL but I could not find the K column even after attempting to unhide. Thank you
Hello Derek,
Thank You for your comment, much appreciated. Contribution is simply $P&L / Equity.
As account grows and shrinks, Absolute $P&L is not as representative.
furthermore, if You have inflows/outflows in your account, then You probably would be better off using contribution instead of P&L.
I have not added time series like modified Dietz, or benchmark, or even currency in the contribution formula so as to keep it simple.
Tip: have a look at the CSR on the Table page. LOok at the component. This is particularly useful.
If You want to find your style, I would recommend You start with a long trading history so as to understand your style.
Then segment into small chunks to understand when the strategy fails. Look at the CSR and think about creative ways to improve your trading edge
The biggest lesson is that the answer is not always in a better signal. It can be in better money management or position sizing
Have fun
Hello friends,
does it matter if I enter absolute P/L instead of returns in the columns avg-win resp. avg-loss? I don’t calculate returns because I am only trading on margin.
Kind Regards
Dincer
Hello Dincer,
I suppose You talking about the PivotTable. Please feel free to replace the field in the table definition.
To be honest, I replaced Profit by contribution because i also trade leveraged and monitor a rather short timeframe.
Let me know if You have a problem.
PS: Just a question out of curiosity. What is your position sizing algo ? How much of your equity are You risking ?
Hope this helps,
Edward
Edward,
Let me know if You experience difficulties. Please read a post about the two types of strategies.
Woah! I’m realy oving the template/theme of this website.
It’s simple, yet effective. A llot oof times it’s challenging
to get that “perfect balance” betwren usability and visual appeal.
I must say you’ve done a great joob with this. Additionally, the blog loads extremely fast for me on Chrome.
Superb Blog!
Thank You very much for your kind words Gus
This is very kind of You. Please feel free to suggest, ask, comment. I get a kick out of the great feedback and genuinely want to help
What’s up, this weekend is good designed for me, as this poinmt in time i am readihg this wonderful informative
post here att my residence.
Hi Lauren,
In your experience of development systematic trading strategies, what are the “average”, “good”, and “great” values for CSR?
Tom
Hello Tom,
Tough question. You know your stuff
Average CSR is 0.97, at least the one I have measured on some portfolios throughout the cycle.
Digging down a bit deeper, this is because a lot of these portfolios have styles: growth, value, small-mid /large carp etc. Markets favour those styles and for some time, managers can touch MC Hammer. They think they understand Jesus, and then they wake up on the cross. Style goes out of favour for some time.
A good CSR would be between 1.2 to 1.6. I am around 2 at the moment but longer time frame i am close to 1.3.
A great would be 2 and above. Now here is the trick to ge t there. If Your tail ratio is above 1 and your Profit ratio is above 1 too, then the most powerful force in the universe, compounding, kicks in.
What usually happens is below 1 and the other compensates.
Depending on your personality, it may be difficult to keep a healthy Profit Ratio (trend follower’s heavy @ss problem), or a long tail ratio (mean reversion left tail)
Thank You very much for this question
I am writing about short selling, trading edge and mental edge. What are your biggest challenges in trading ?
Thank for a very clear explanation, Lauren.
My challenges:
1. Trading edge: Short-selling in equities, especially with a trend following style. The goal is not just for diversification (currently most mean reversions in my portfolio), but to learn how understand market better in a quantitative framework.
2. Mental edge: How to incrementally raise my emotional intelligence, starting with trading since it’s more concrete, i.e. the P&L is objective.
Hello Tom,
Thank You for your reply,
Both are tall orders.
1. Trading edge: trend following style. I assume You are not doing options. Then 1. define the trend 2. wait for rebound to roll over to enter 3. take risk off the table as it is about to rebound again. Do not hold the entire through the rebound as it often goes past entry point.
If You are mostly mean reverting on the long side, then i would suggest a mean reversion approach on the short side as well. Now (+/- 1-2 days) is about the right time to start shorting. A lot of ETFs have had straight run-up for 13 days consecutively. They need a break.
Mean reversion short selling is actually easier than trend following.
2. Mental edge: Are You familiar with work of Rande Howell ? Rande says that P&L is a reflection of inner alignment. I would highly recommend his stuff. He does some unique work around Pearson Marr and Jungian archetypes. Calm.com is a fantastic App. I hear You. I wish I was more advanced spiritually and mentally.
Thank You again for your message
Tom,
Once again, thank You for sharing. I really appreciate and value your comment.
I will meditate upon it and do my best to help
Cheers,
Laurent
Hey there! I know this is kinda off topic however ,
I’d figured I’d ask. Would you be interested in trading links or maybe guest authoring a blog article or vice-versa?
My site goes over a lot of the same subjects as yours and I feel we could greatly benefit from each other.
If you happen to be interested feel free to send me an email.
I look forward to hearing from you! Wonderful blog by the way!
Hello
Sure. Always happy to help people and share good knowledge
Cheers,
Laurent
Wonderful, what a blog it is! This web site gives helpful facts to us, keep it up.
Thank You very much
This site was… how do you say it? Relevant!! Finally I have found something that helped me.
Thank you!
Thank You
Hey I am so grateful I found your weblog, I really found you by accident,
while I was searching on Digg for something else, Nonetheless I am here now and would just like to say thank
you for a fantastic post and a all round interesting blog (I also love the theme/design), I don’t
have time to read it all at the minute but I have saved
it and also added in your RSS feeds, so when I have
time I will be back to read much more, Please do keep up the awesome work.
Pretty cool article. I own a trading analytics company called Trademetria (www.trademetria.com) and it is always great to see clever ways to not only find an edge but to quantify it. I will definitely experiment with the trading edge formula you mentioned in the article as well as the visualiser.
Buon dia Thiago,
Como vai voce? Tudo Bem?
I am writing a book on short selling: “the virtue of short selling”, why is short selling the most valuable asset class, your pension best friends and how to develop a trading edge.
Part I demystifies short selling and demonstrates that it is the most valuable, underappreciated asset class
Part II is about developing a trading edge. It demonstrates step-by-step how to calculate and hack your trading edge
Part III is about the mental edge: it lays out the hierarchy of trading: biology of trading, trading brain, trading mind, trading consciousness. Then 3 strategies for inner alignment. 90% of trading is mental, the other half is good math
Part IV talks about building a Long short product that sells. It starts with what clients want and then goes step by step into the process. There are plenty of useful formulas such as how much profit to take, max risk per trade, simplified convex position sizing (something your brain can trade), brain hacks to become an idea factory on the Long and short side. I have been in the Long Short equities/options business for 16 years, both on the HF side and institutional side at Fidelity
If You like the stuff on trading edge, then You will probably like the book too. More importantly, it is written in a funny easy to read way. There are quotes from the Great Chinese philosopher Bruce Lee, the martial artist Mother Teresa, the great American poet Mohamed Ali.
Pretty nice post. I just stumbled upon your weblog and wished
to say that I have really enjoyed surfing around your blog posts.
After all I will be subscribing to your feed and
I hope you write again very soon!
Greetings! This is my 1st comment here so I just wanted to give a quick shout out
and say I genuinely enjoy reading your blog posts. Can you recommend any other blogs/websites/forums
that go over the same subjects? Thanks a ton!
I am most active on Quora. Ask Questions and i will diligently answer
I don’t comment, but I browsed a great deal of cmments oon this page The Trading Edge Visualiser User’s Manual – Alpha
Secure Capital. I ddo have 2 questions for you if you do not mind.
Could it be onmly me or do a few of these responses appear
like they are written by brain dead folks?
😛 And, if you are writing on additional onlline social sites, I would like to follow anything fresh
you have to post. Could you make a list of every one of your shared pages like
your linkedin profile, Facebook page oor twitter feed?
You can find me on Quora, or Linked in under Laurent Bernut
Hey there! I’vebeen following our weblog for some time noww and finally goot thhe bravery to go ahead and give
you a shout out from Humble Tx! Just wanted to say keep up the excellent job!
The Trading Edge Visualiser was built using Metatrader 4 OrderLog.
Does this mean I have to have Metatrader 4 installed to use this?
Merry Christmas Alan,
No, You do not need to have MT4 installed. Since this is Christmas, send me a csv of your trading history and i will process it for You. This will be a template You will be able to re-use
Here are the fields i need:
Buy/Sell
Unique identifier: Sedol, ISIN, ticker symbol whatever
Open date
Close date
Quantity
P&L
If You run a multistrat account, identify the strat on each trade
If You want an attribution (%) distribution, then send also an account balance log. Otherwise, default is in $ or whatever absolute currency
Now, I do not want to reverse engineer your strategy. I do not want to piggyback and trade on your ideas either. I only want to help. Best thing is to send a file of closed old trades.
Merry Christmas
This is all logical but I am having trouble with exactly how you define and calculate “Tail Ratio’ and ‘Gain to Pain’ Ratio?
Could you provide a formula like the one for ‘Trading Edge’?
Thanks
Hello Jeff,
Tail ratio= ABS( percentile(P&L, 0.95)/ percentile(P&L, 0.05))
P&L can be either contribution in %, absolute P&L in $. The idea is divide the right tail by the left tail. A longer right tail is obviously better than left one. Mean reversion strategies have game-ending long left tails and comparatively short right ones
Tail ratio measures the risk of mean reversion strategies
Profit ratio = ABS(sum(profit)/sum(losses))
The ratio of total profits to total losses is gain expectancy/trading edge reformulated as a ratio. Trend following strategies fail because profits cannot compensate for the multitude of small losses.
Risk for trend following strategies is in the aggregates hence profit ratio
Common Sense Ratio = Profit ratio * Tail ratio
Multiplication is transitive, so it recaptures both risks in a single unified measure
Merry Christmas Jeff
Thank you for the quick reply to my request for the formulas.
When I read your response I realized this all dovetails nicely with Nicholas Taleb’s (Of Black Swan fame) book ‘Antifragile’.
According to Taleb, ‘Reversion to Mean’ systems would be considered more fragile, since the system’s skewness points to left tail events that are very negative, perhaps even cataclysmic in large enough doses
Trend Systems would appear to be more anti-fragile. If you have not read his work, antif-fragility refers to things that actually benefit from unexpected shocks. ie right tail events.
I try to trade both methodologies, since at times trend following is just not what the market is rewarding. So I really like your ideas for extending the right tail by keeping a portion of winners longer than perhaps traditional reversion strategies suggest.
Jeff
Hello Jeff,
In the upcoming book, i explore techniques to tilt the trading edge according to one’s dominant style. The idea is that some people are inclined to follow trends, others are more prone to trade mean reversion. Example, growth guys trade trends, while value dudes trade mean reversion.
An ideal distribution would blend both styles. As You said, sometimes the markets reward trends, sometimes mean reversion. Since market participants have different mindsets, they need to rewire their thinking and incorporate different techniques.