What is the difference between stock trading and gambling in a casino?

MonteCarloAnswer by Laurent Bernut:

I’ll give You the same answer I gave two CIOs of Fidelity. The common point between professional poker players, star fund managers and street hookers is that they go to work: it is not meant to be fun.
Excellent question. Beyond taxes and manufactured negative gain expectancy, there is much market participants could learn from professional gamblers:
  1. Gambler’s serenity prayer: grant me the serenity to accept folding a losing hand, the courage to take calculated risk and the wisdom to know the difference
  2. Cut losses and run winners: in poker, money is made by folding a lot and be aggressive a few times. Successful fund managers spend their time cutting losses. The paradox is that the way to win the war is to accept losing small battles
  3. Position sizing: Black jack is a game where You play against the house. It is manufactured to have You lose. Yet, Edwin Thorpe, whose track record towers Warren Buffet’s, beat the dealer. His method forced casinos to adapt. His secret sauce was position sizing, a fraction of Kelly criterion
  4. Position sizing algorithms: Gambling is a far more mature industry than investing in the sense that a lot of position sizing algorithms used in finance come from game theory. Martingale, reverse-martingale, drawdown/run-up of bankroll, Kelly Criterion
  5. Gambling is boring: hookers, poker players and star managers go to work. It is not meant to be fun. They leave their emotions at the door. Treat gambling and markets as a job so that You can fleece the emotional players
  6. Gamblers have a system: gamblers are not smarter, they have smarter gambling habits. Adherence to a system takes discipline. Reinforced discipline is called habit
  7. Gambling as trading is not a zero sum game: one of the most common myths about the market is the zero sum game. Slippage, commissions erode however slightly the account. Take every trade as if You put a chip on the table
  8. Quantified risk: the notion of calculated risk has unfortunately been perverted by those who do not understand it. Risk is not an abstract dissertation at the end of an investment thesis. Risk is a hard cold probabilistic number
  9. Odds and win rates: one of the fallacies of market participants is the belief they need above 50% win rate to be successful. 2 things here: 1. trading edge or gain expectancy shows that low win rate can be compensated by big payouts. 2, Distributions of P&L of most traders (excluding mean reversion and market making) show aggregate win rates over the cycle of 30-45%. Winners compensate for losers. The important lesson here is that traders walk into a trade expecting it to win, when they should be mentally prepared  for a loss. Pre-packaging grief (see my post: The view from the short-side: how we process emotions and the market signature of the 5 stages of grief Kubler-Ross by Laurent Bernut on Alpha Secure ) . This means that throughout the cycle, styles come and go. Making money means knowing when your style is out of favour and betting small and then when in fvaour take risks. Back to the serenity prayer
Conclusion
Investors usually look down on gamblers. Yet, there is much to learn from gamblers. How come a few of them become successful despite built-in unfavorable odds ?
Beginners in both markets and gambling believe they are on to something when they double down after each loss. They believe that their luck is about to turn, so they use martingale (it comes from the French for winning streak). They just forget two things: dice have no memory so each run is independent from the previous one. More importantly, the maximum expected value is break-even. This means that any outcome other than the best one carries an interesting probabilistic property called “certainty of ruin”.
In other words, there is a reason why casinos have gold, marble columns, master paintings and rookie gamblers go broke…

What is the difference between stock trading and gambling in a casino?

The Habit of Short-Selling

Selling short is not antipatriotic. It most certainly is not a hedge to Long. The only commonality with art is that 90% of artists starve. Short-selling is not some shadow conspiracy undermining the economy. No short sellers seats on any board on sinking ships. Short-selling is none of that.
Short-selling is a habit, just like exercise, healthy eating of brushing teeth. t may be mundane and boring, but eventually it is something that makes You healthier, stronger and eventually happier.
I have been a 100% systematic quantitative short-seller in a prestigious bottom-up fundamental house for 8 years. My mandate was to underperform the inverse of the longest bear market in modern history: Japan Equities. Every day, I woke up -100% net short, welcome to my world.


The hero’s journey of short-selling
“Too many people look at what is from a position of “what should be”, Bruce Lee
We, human love stories. We relate to the hero’s journey, because we aspire to be one. Now, ask yourself: do You want to retire on stories or on healthy returns ? If You still cling on to the story, then read no further and see You in the octagon of the markets…
Short-selling is a hero’s journey, but the story of redemption is unappealing. The journey is about unlearning, calculating, mastering emotions, baking the daily bread. Even if You choose never to sell short, that process itself will make You a stronger investor.
Please subscribe to my website. It is completely free and there are useful resources for serious market participants: Alpha Secure Capital | Alpha Secure Capital
The myths of short-selling
“The usefulness of a cup is its emptiness. Empty your cup”, Bruce Lee
  1. Unlimited downside: would You floor a Maserati knowing it has no brakes ? Well, if You can answer this question, either You can’t afford one or You have just fixed their notoriously bad brakes. Rule 0 of short-selling: set your stop loss before entering a position.
  2. Structural short: structural shorts are just like stupid people: they are everywhere. Profitable structural short is The Unicorn of short-selling (capital T, capital U). By the time the word structural short is associated with a stock, Borrow cost, short squeeze frequency, volume etc all suggest that the Long side is no longer the wrong side. More importantly.
  3. Fundamental shorts: Fundamentalist grieve their way into Short-selling (The view from the short-side: how we process emotions and the market signature of the 5 stages of grief Kubler-Ross by Laurent Bernut on Alpha Secure ). This is an expensive process: every bit of information that ultimately leads to a short has a price-tag. Everyone gets burned while short-selling. So, next time around, we take precautions. We want our story straight, our numbers squared, our facts checked and our boxes ticked. Well, if that is what You want: join the crowded short crew
  4. Contrarian shorts: there are two ways to kill bulls: either in 1. a  triumphant corrida with a colorful display of courageous faena as the bull bites the warm dust or 2. zapping them in a slaughterhouse while listening to cheesy pop songs. Second option does not get the glory but does not get the horns either. Selling short is done along Long selling.
The dynamics of Short-selling

1. Structural shorts are a form of a laziness

Back in hedge fund days, My manager took notice of my keen interest in selling-short but also took umbrage at the accompanying trading activity. He then proceeding to instruct me to look only for structural shorts. What he really meant was:
  1. I don’t want to bother with shorts: they are not fun. They are complicated, unsexy and messy
  2. I just want to go Long, have fun, find 2-3-4-10 baggers and be a rockstar, but:
    1. This is a hedge fund: so we need to hedge, right ? But also I want to:
    2. Charge big fees: no-one is stupid enough to pay 2-20 if I just sell futures or buy ATM puts
  3. So, I need to find shorts (… so as to generate cash and buy even more Longs…)
  4. Then, find me shorts i can SHORT & FORGET: throw away the key, they go down nice and easy. I can forget about them and then I can focus on finding 2-3-4-10 baggers and be a rockstar
Well, the fund went bust. This is not character but myth assassination here. There is no such thing as a structural short. The short book shrinks when successful so it requires more attention than the Long book. That is just a plain arithmetical truism.
2. The curse of successful shorts: the Short “magic skin” (peau-de-chagrin)BalzacMagicSkin01
Successful shorts are the “magic skin” of the markets: they shrink as they are successful. This means their good attributes such as Beta, sector  country, currency, market cap bracket, exchange exposures contribute less and less. It means You have less of a good thing when it works. This entails three things:
  1. Successful shorts must be replenished
  2. the Short book needs constant attention: shorts have naturally shorter cycle and shorter lifespan. So, they need constant attention
  3. Unsuccessful short must be weeded out: unsuccessful shorts balloon. So, You are left with more of something undesirable
This leads us to the secret behind successful short-selling. It is a simple yet powerful “haha” moment question that will alter your reality
A suivre…, to be continued…
If You want part II, III and IV, please subscribe to my website. It is completely free and there are useful resources for serious market participants: Alpha Secure Capital | Alpha Secure Capital

The Habit of Short-Selling

Has anybody gotten rich through automated trading?

Happy New Year from Alpha Secure Capital. This was an answer to a question on Quora. It has been read by more than 16,000 people.

Now, I am a digital nomad investor: Viet Nam, Singapore, Tokyo, KL, Venezia, Palermo, Reikjavik. Rents get paid in our sleep, balance gets bigger by 1-3% every week. Dream life, hey (*) ? Well, it came at great sacrifices.

Autotrade sub 30 mn is the tallest order in the trading industry. On the one hand, there are HFT shops, with whom there is no point competing. They already do a wondeful job at killing each other not so softly. On the other hand, point and click prop shops ecking penny after penny. Then, there are Delta one and deriv desks arbitraging small corners away. All those guys have the money, the resources, the access, the info, the programmers You will never have. You are outgunned, outnumbered and let’s face it: outside. Now, let the race begin.

It took me 15 years to mature the concepts, 3,694 hours to code, 3 2/3 years to run  and a lifetime to refine them. This has consumed my life, my waking hours, my sleep. Ever woke up breathless and feverishly write equations ? I nearly burned the house not once, but twice, because i forgot that there was something on the stove, while i was wrestling with some C#. Once, my wife came yelling at me for not taking care of our screaming baby. I just did not hear our daughter crying… on my lap. Well, code would not compile…

Sisyphus stones
Then, there is the sheer frustration of never being enough. Then there are bugs. One rule of thumb, never add, always subtract, always come to simplicity when solving bugs. Then, there are “100 year flood”, perfectly rhyming with the late “100 nights of solitude”. Then, there are platform issues. They are not meant to do scale-out/scale-in and adaptive position sizing. Then, there are those small issues that You will have to face one after the other.  There will be times where You wander and meander like Ulysses, “what if this, what if that ?” But there also those immensely gratifying days when You wake up with light and equations flowing through like when I found my personal holy grail of position sizing

After the Daedalus of development, one day the end will be in sight; it will be there, almost, just a few modules away. But then, there are those shortcuts You took 10 iterations ago that will come back and bite You. They stand between You and the finish line. And You know that tackling them means overhauling the entire architecture.
This is the realm of frustration. The last mile is always the hardest. Please remember this though: autotrade is like watch-making. Until the last cog fits in the right place, your clock will always be off, so don’t give up, never give up.

Then, You run your own money, face drawdowns, go back to fix the last few bugs. Then, You run it on small amounts. The best moments are not when You make your previous monthly salary in a week while kitesurfing or going wine tasting. The most beautiful moments are when You make those few hundred dollars week after week and when You finally know it is viable. It feels like watching a flower blossom. This is the best sleep You will have in your lifetime, well at least for 3 months …

Here are the lessons I learned. A viable trading system is built backward:

  1. Focus on the short side: the short side is notoriously harder. If Your system works on the short side, it will work on the Long side. Any 3 star Michelin chef can flip burgers. Now how many Burger king employees can do 3 star meals ?
  2. Focus on the exit first: a race is never won until the finish line is crossed. Some of your positions are marathonians, some are sprinters. You never know until You see them on the field.
  3. Stop loss: it is the only variable that has a direct influence on 3 out of 4 variables of your trading hedge
  4. Money management is key: how to preserve capital when your system won’t work and how to take calculated risk when it does ? This is where the heavy mathematical artillery should be concentrated, not on the entry. Think about it: everyone owns Apple. The difference that makes the difference is how big You are
  5. Simplicity: complexity is a form of laziness. If your solution is still complex, it means You have not worked hard enough to find a simple one. There is no exception to this truth
  6. Symmetry: once the short side delivers, translate it to the long side. You will have unambiguous signals, unified risk management
  7. Watch Star Trek and the original Kardashians, they were not as villains as the newer ones, breaking bad, desperate house wives etc
  8. Then, last and very least, but first take the dogs out. And then finally, sorry don’t forget to water the plants first. And then finally, oops have You called your mother yet ? And then finally, take the trash out and after a good night of sleep, You may think about entry. Entry is at the very bottom pile of the priority list of an autotrade strategy, long after labeling priorities on multiple positions

In the end, You will realise that the goal was never about money. It was first about the freedom from a paycheck and the long term uncertainty of retirement. Rich and wealthy are not synonymous. Rich should be the experiences You accumulate over your life. Now, we live out of our suitcases, frugally as usual, but what a life! Speaking of which, time for a Prosecco with our neighbours, our landlord the architect and his buddy the last Gondola maker in Venezia

(*) Now, the highlights of our week is to hunt for consecutive stop losses. We have excess capacity. We have suffered a great deal coming up with our strategy on MT4. Most modules had to be built from the ground up. We  genuinely want to spare this Sisyphean ordeal to aspiring autotraders.
So, we will choose 2 or 3 people and help them build their strategy.
I can help anyone formalise their own strategy through a thorough guided discovery process. This is not pleasant.
Then on the MT4 coding side, the person I work with is a senior programmer for the US Department of Defense (be nice to him or he will bring democracy to your computer…). I can code alright, but his stuff is military grade… Reach out if You are interested, or if You like what You read

Has anybody gotten rich through automated trading?

How complex are the algorithms used by financial institutions such as Goldman Sachs and other hedge funds in their proprietary trading so…

This is an answer to a question on Quora. It got re-posted and shared across Quora users.

Answer by Laurent Bernut:

Complexity is a form of laziness
Complexity is fragile: it works until it does not

There are two types of algos: low-latency and systematic algos.

Low-latency is the realm of HFT. Those algos can be quite intense. Read dark pools or flash boys. There are now algos gaming other algos. It is a bit like the “sperm war” in the “red queen”, a book on evolutionary psychology.

At the other end of the spectrum is systematic trading. It stems of the belief that if investment is a process, then it should be automated. Those algos are conceptually easy to understand. They are not however always easy to program.

At the end of the day, algos are a reflection of the philosophy, beliefs of those who design and code them. Those who have not mastered their craft will gladly put lipstick on a pig, by adding complexity to flawed concepts.
Those who have worked a bit harder will simplify. Simplicity is not easy

Sorry for the philosophical answer

How complex are the algorithms used by financial institutions such as Goldman Sachs and other hedge funds in their proprietary trading so…

Algorithmic trading: How to get started building an algorithmic trading system?

This is an answer to a question on Quora: Algorithmic trading: How to get started building an algorithmic trading system?

Answer by Laurent Bernut:

If investment is a process, then the logical conclusion is automation.
Algorithms are nothing else than the extreme formalisation of an underlying philosophy.

This is the visual expression of a trading edge
Trading edge = Win% *Avg Win% – Loss% *Avg Loss%
It changed my life and the way I approach the markets. Visualise your distribution, always. It will help You clarify your concepts, shed light on your logical flaws, but first let’s start with philosophy and belief elicitation

1. Why is it important to clarify your beliefs ?
We trade our beliefs. More importantly, we trade our subconscious beliefs. “If You don’t know who you are, markets are an expensive place to find out”, Adam Smith
Many people do not take the time to elicit their beliefs and operate on borrowed beliefs. Unanswered questions and faulty logic is the reason why some systematic traders tweak their system around each drawdown. i used to be like that for many years.
Belief elicitation exercises:

  1. The Work by Byron Katie. After i completed a 2 beliefs a day challenge for 100 days, i could explain my style to any grandmother
  2. 5 why ? Ask yourself a question with “why” and dive deeper
  3. “I am”: beliefs about self are best elicited when we start with this sentence stem
  4. Sentence completion exercises: Nathaniel Branden in his work on self-esteem has pioneered this method. For example, “to me a robust trading is…”

Mindsets: expansive and subtractive or masala smoothie Vs band-aid
There are two types of mindset, and we need both at different times:

  1. Expansive to explore concepts, ideas, tricks etc. Expansive mindset is useful in the early stage of strategy design
  2. Subtractive: to simplify and clarify concepts. Complexity is a form of laziness. Instead of adding yet another redundant factor, try subtracting one or two. Work hard until You find an elegant and simple solution

Systematic traders who fail at being subtractive have a smoothie approach. They throw all kinds of stuff into the optimization blender and waterboard data until it confesses. Bad move: complexity is a form of laziness.
Overly subtractive systematic traders have a band aid mentality. They hard-code everything and then good luck patching
“Essentialist traders” understand that it is a dance between periods of exploration and times of hard core simplification. Simple is not easy
It has taken me 3,873 hours, and i accept it may take a lifetime

2. Exit: start with the end in mind Counter-intuitive truth
The only time when you know if a trade was profitable is after exit, right ?
So, focus on the exit logic first.
In my opinion, the main reason why people fail to automate their strategy is that they focus too  much on entry and not enough on exit.
The quality of your exits shapes your P&L distribution, see chart above
Spend enormous time on stop loss as it affects 4 components of your trading system: Win%, Loss%, Avg Loss%, trading frequency
The quality of your system will be determined by the quality of your stop loss,

3. Money is made in the money management module
Equal weight is a form of laziness. The size of your bets will determine   the shape of your returns. Understand when your strategy does not work and reduce size. Conversely, increase size when it works.
I will write more about position sizing on my website, but there are many resources across the internet

3. Last and very least, Entry
After you have watched a full season of “desperate housewives” or “breaking bad”, had some chocolate, walked the dog, fed the fish, called your mom, then it’s time to think about entry.
Read the above formula, stock picking is not a primary component. One may argue that proper stock picking may increase win%. Maybe, but it is worthless if there is neither proper exit policy, nor money management.
In probabilistic terms, after you have fixed exit, entry becomes a sliding scale probability

4. What to focus on when testing
There is no magical moving average, indicator value. When testing your system, focus on three things:

  1. False positives: they erode performance. Find simple (elegant) ways to reduce them, work on the logic
  2. periods when the strategy does not work: no strategy works all the time. Be prepared for that and prepare contingency plans in advance. Tweaking the system during a drawdown is like learning to swim in a storm
  3. Buying power and money management: this is another counter-intuitive fact. Your system may generate ideas but you do not have the buying power to execute. Please, have a look at the chart above

I build all my strategies from the short side first. The best test of robustness for a strategy is the short side:

  1. Thin volume
  2. brutally volatile: this
  3. shorter cycle: stocks go up the elevator and go out the window
  4. Borrow availability:

Platforms
I started out on WealthLab developer. It has a spectacular position sizing library. This is the only platform that allows portfolio wide backtetsing and optimisation. I test all my concepts on WLD. Highly recommend. It has one drawback, it does not connect position sizer with real live trading.

Amibroker is good too. It has an API that connects to Interactive brokers and a decent poisition sizer.

We program on Metatrader for Forex. Unfortunately, Metatrader has gone down the complexity rabbit hole. there is a vibrant community out there.

MatLab, the expensive weapon of choice for math graduates. No comment…

R: much better cost-performance than Matlab, simply because it is free

Tradestation
Perry Kaufman wrote some good books about TS. There is a vibrant community out there. It is easier than most other platforms

Final advice
If You want to learn to swim, You have to jump in the water. Many novices want to send their billion dollar ideas to some cheap programmers somewhere. It does not work like that. You need to learn the language, the logic.
Brace for a long journey

Algorithmic trading: How to get started building an algorithmic trading system?

People talk about an edge in trading yet never want to discuss what their edge is. Can you give an example of an edge that no longer work…

Answer by Laurent Bernut:

Edge can be summed up in a formula that applies to any instrument (see below). Like risk management, everyone like to talk about it, but few people actually can distinguish between sustainable, stylistic, and systemic edge

I. Examples
Let’s start with examples:
Chinese IPOs: Institutional and some retail investors participate in IPOs. Classic trade is to sell half to 100% of the allocation at the Open of the first day and book the disount. Chinese IPOs used to go up 100% in 3-4 days.
That “edge: is clearly gone now that they open 50% below and that “investors”/flippers have to keep their holdings for a certain period.
More on Chinese IPOs later when we talk about specific versus general

Stock split: there was a strange loophole in Japan, where stock split were announced 2 weeks before effective dates. So, the trade was to go Long prior, reverse the trade and go short at the close of the day before the split went ex-date.

Korean USD trading
In Korea, foreign participants had to trade in USD, while locals were allowed to trade in KRW. And then You wonder why some markets never seem to go anywhere ? Borrow availability was vastly different.

A shares B shares in China
Foreigners were not allowed to trade A shares.

Prop trading:
This is probably one of the most egregious “edges”. Prop traders were carrying their facilitation business and encouraged to hold their own book…

II Types of edge
Systemic edges:
Locals in China and Korea were legally able to milk foreigners. This had nothing to do with talent. Arguably, it might have encouraged complacency. This is systemic edge. Another example of systemic edge is Ali Baba. There is no real competition from other shopping malls.

Those edge exist as long as regulatory inefficiencies are there to protect them. They are fragile, fickle but can last for some time.
They sometimes can be double edged. In their panic moves to contain the fall, Chinese authorities have asked some brokers like CITIC to engage in price stabilisation activities.

Stylistic/cyclical edge:
Some people know how to trade GARP (growth at reasonable price). Some know how to trade value. Others know how to ride Beta.

Their edge last as long as markets reward their style. Unfortunately, investors find it difficult to distinguish between skill and style. In other words, are managers good (or bad) because of what the markets reward (or punishes), or are they good because they adapted to what the markets reward.
There has been a lot research on the topic. Quants sometimes refer to this as luck versus skill.
A simple, down to earth trick to find out is: how do those managers fare when market style changes ? Does their performance suffer much more than the markets or can they contain losses ?

Sustainable edge
The rarest form of edge and the least talked about is sustainable edge. The reason why few people talk about it is because either deep down they know they do not have anything special, or they believe their outer game constitute sufficient sustainable edge.
For example, biotech analysts clocking 2-3 baggers one after another was great until a presidential candidate stopped being supportive of the industry. Unfortunately, no bull market has ever boosted anybody’s IQ.

III. So, how do we measure trading edge ? Where do we find examples  and can it be replicated ?

A. Trading edge formula
Every trading strategy, investment method, track record that has, is and will be boils down to this formula:
Trading edge = Win% *Avg Win% – Loss% * Avg Loss%
This is also known as gain expectancy. This is just another fancy way to say average profit.
Guys studying finance have never heard of that one. They have heard a lot about efficient markets from guys with zero beginning of real track record…

Robustness of the edge can be tested via a t-stat. Van Tharp has popularized the formula by rebranding it into SQN: System Quality Number

t-stat = SQRT(trades) * Trading Edge / STDEV(Loss)

This t-stat recaptures frequency and deviation from the mean. In other words, it is OK to have a spectacular trading edge but it is quite useless if it trades every Friday 13th full moon (next one in 2017 and the after in 2023)

B. Examples of sustainable trading edges
In order to constitute a valid trading edge for any specific “investment obedience”, trading edge must be transmissible across the “trading tribe”

This immediately eliminates discretionary fundamental investing. Everyone in the fundamental analysis business likes to make reference to Warren Buffet. Yet, very few have a comparable performance.
I do not hate fundamental analysis, quite the opposite in fact. A good analogy is rock n’ roll. ELVIS and Ted Nugent are both rockers. Yet, no-one would ever dare putting The KING and that trigger happy human evolutionary challenged specimen in the same basket.

I wish I could say Value investing has some sustainable edge. Unfortunately, like fundamental analysis, the word has been perverted and used by everyone with a marketing pamphlet.
There is evidence of sustainable edge in systematic value investing.

Systematic trend following CTAs have a systematic edge. Their style has generated alpha over decades. Trading edge is transmissible: newer guys seem to fare well. (for disclosure purposes, I am not a CTA)

C. Can it be replicated ?
This is probably the most important question. No-one really cares about their neighbor  trading edge. What they really want to know is: how can i develop my own trading edge ?

This is where the conversation takes on a different perspective. There are only two types of edge: specific and general.

Systemic, stylistic/cyclical edges are specific. They focus on a particular edge over the rest of the competition.
“Stock pickers” focus on getting this or that particular stock “right”. This is extremely specific.
General edge on the other hand is about making sure the above formula has a positive sign before the number.

The reason why CTAs have a sustainable replicable edge is not because they pick better stocks. They are not trying to be right on their view about lean hogs or German bunds. They trade the same asset class across various markets. That asset class is called risk. It has a number attached to it.

They can maintain a sustainable edge not because they try to be specifically right, but because they choose to remain generally right.

In other words, this is outcome versus process thinking.
Process can be formalised and quantified. As the great motivational speaker Jack Welch used to say: everything that can be quantified can be improved.

D. How to improve your edge ?
“He who controls the past controls the future”, 1984 George Orwell

Very few market participants have the courage to keep an honest record of their past trades. We are our trading history.
For example, my trading history is part of my every day position sizing. How i size my positions today is conditioned by how well past trades have performed. If they perform poorly, then I should trade smaller so as to preserve both financial and emotional capital.

1 Know your style
The first is to build a P&L distribution of your trades and find your style. There are only two types. Please look at my blog about mean reversion and trend following. Know and understand your style.

2. Know when your style stops working
It is great to be the best figure skater, but August tends to be a bit dull.
The simplest way to improve your edge is to limit drawdowns when your style goes out of favor.
Remember this very simple truth: profits look big only to the extent that losses are kept small. hardly rocket surgery, isn’t it ?

3. Restore normal risk when your style is in favor
This one goes against mainstream that encourages You to take risk when it works. The problem with this is how much is enough ?
Kahneman says we suffer from chronic overconfidence. That means we take too much risk and then get humbled.
So, my suggestion is not to take on more risk when it works. My suggestion is to take less risk when it does not.

Conclusion
Long answer, but prosecco was good this evening

People talk about an edge in trading yet never want to discuss what their edge is. Can you give an example of an edge that no longer work…

Sharpe ratio: the right mathematical answer to the wrong question

Andrew Swanscott runs the podcast Better System Trader. This is great resource: fantastic interviews with real-life practitioners.

http://bettersystemtrader.com/032-laurent-bernut/. I made a statement that attracted a few comments from listeners: Sharpe ratio is the right mathematical answer to the wrong question. Here is the answer as Andrew kindly re-posted on his website.

Sharpe was the right answer

First, let’s start with what Sharpe does well. There are two things it does well:

  1. Cross-asset unified measure: we all know that the most important component in alpha generation is asset allocation. Now, the difficulty is to have a single measure of risk adjusted measure of alpha. This is where Sharpe did the job. It could give a single number across many asset classes: be it fixed income, equities, commodities etc.
  2. Uncertainty: the human brain is hard wired to associate uncertainty with risk. It triggers the amygdala and activates the fight, flight or freeze reflex (see one of my posts about fear and greed). So, Sharpe is a good measure of uncertainty: it quantifies units of uncertainty adjusted performance.

Now, Sharpe ratio, as part of the modern finance package, was invented the same year of the coronation of the Queen of England. It was good, almost revolutionary for its time, since Batista in Cuba was fighting El Che and Fidel. But, like the UN building designed by Brasilian Oscar Niemeyer, it did not age well, and here is why:

Sharpe is not a measure of risk, it is a measure of volatility adjusted performance

Sharpe equates volatility with risk. Risk does not equate volatility and here are a few examples:

  1. Low vol may be extremely risky: LTCM had low vol. In fact, their strategy was to be short gamma. It worked until it did not. Fast forward 2008, vol funds collapsed one after the other. Low vol does not equate risk.  As the great American philosopher Yogi Berra reminded us: “in theory, theory and practice are the same. In practice, they aren’t”. In theory, CDOs and CDs were AAA, low vol high yield products.In practice, they weren’t
  2. CTAs like Ed Seykota, Tom Basso, Bill Dunn, William Eckhardt etc: they have supposedly hopelessly low Sharpe but have clocked >+25% year in year out.

Does it mean that the CTAs have risky strategies ? No, it means they have low semi-volatility adjusted strategies. Semi-vol is just downside volatility.

Volatility means uncertainty, just learn to get comfortable with it

As much as uncertainty is not pleasant and may trigger some reptilian alarms in our brain, we must learn to live with it. It involves mindfulness meditation, strict formalisation of strategies etc. Do not pray for an easy life, pray for the strength to endure a tough one.

Now, what is risk ?

Risk is not a small paragraph at the end of a dissertation called investment thesis. Risk is a number. The only difficulty is to find the adequate formula that goes along. There are two types of strategies: mean reversion or trend following. Please read my posts on the subject.

Risk is not difficult to quantify. It is only difficult to identify. I have come up with the common sense ratio as it recaptures both mean reversion and trend following strategies.

CSR = tail ratio * gain to pain ratio

sense ratio as it recaptures both mean reversion and trend following strategies.

CSR = tail ratio * gain to pain ratio

Please use the trading edge visualiser to find out your personality:

TradingEdgeVisualiser

Conclusion

Bottom line, we have associated risk with volatility. We have come up with a measure of volatility adjusted performance and deem it a risk measure. CSR, on the other hand, is a unified risk measure that can be used across asset classes. It measures risk according to strategy type.

Please subscribe and get some files, material and resources. This is all free so take advantage of it.

What the great Chinese philosopher Bruce Lee can teach Fund managers about mastery

Answer by Laurent Bernut: This was originally a question on QUORA: which investment method is the best ?

As the Great Chinese philosopher Bruce Lee said: “have the style of no style, be water my friend”Game of death

There are two games of trading: outer and inner game of trading

Stage 0: Dunning Kruger effect
The Dunning Kruger effect is a cognitive bias where unskilled individuals believe in their illusory superiority. It is often found in senior management of old listed companies such as Volkswagen, Kodak, Sony etc. When Bruce Lees did not know anything about Wing Tsun, he thought a punch was merely a punch. After he had internalised his craft, a punch became just a punch.
In the beginning, anyone thinks the stock market is easy. Then they lose

Stage 1: Exploration
Bruce Lee not only explored Wing Tsun, but also English boxing, karate.
At this stage, market students embark on an exploratory phase to build a syncretism of what they think is best.

Stage 2: Perfection
This is the most common mistake of all outer game centered practice. Students perfect their craft and believe their style beats any other style out there. MMA is better than Brazilian Jiu Jitsu. Kyokushinkai is more resilient among karate etc.
Still, students myopically concentrate on their microscopic universe and fail to embrace diversity. They may be outwardly good, but they are still trapped in the outer game.

Stage 3: Acceptance
Responding to a challenge from other Kung Fu teachers, Bruce Lee defeated his opponent in a  whooping 3 minutes. In doing so, he injured himself and pestered about how long it took. He then proceeded to enrich his repertoire.
This is the first stage of inner game. This is where internalization and deep learning starts.
This is the essence of the “10,000 hours”. This is where “flow state” happens. Students redefine their identity. They free themselves from the confine of the style they used to practice.

Stage 4: Mastery “Be water my friend”
At this stage, students redefine the game. They bend reality. It becomes effortless. Master traders and investors have redefined their game. They have a congruent universe governed by a simple set of rules.

So, in conclusion, there is no superior method: fundamental, quantitative, technical, HFT, etc. There is a better method for You that suits your personality. It is incumbent upon You to find your path on the markets. Believing that fundamental or technical analysis is the way to succeed, just because everyone else around is doing it, will not work. They are also struggling. A long journey on the markets begins in stillness

Which investment method is the best?

What programs are usually used to back-test trading strategies?

Answer by Laurent Bernut:

Testing a strategy is a journey. For any journey, You need the right equipment. I test everything on WealthLab then program on other platforms. Here is why

The objective of back-testing is to simulate real trading. When You trade real money, You face the following problems:

  1. Position size: You do not trade 1 share per trade. You may have sophisticated position sizing algo. Platforms offering position sizing algos in back-testing phase are few and far between: WealthLab & amiBroker. QuantConnect and Quantopian may but I have not tried
  2. Cash constraint: You strategy may generate signals but if You do not have cash to execute either a Buy Long or a Buy to Cover, it is a moot point. WLD and amiBroker
  3. Portfolio rotation: this is similar to the above point. Test may look great/poor on one security but in real life, you trade a portfolio.
  4. Slippage & commission: always set slippage at max. My settings is -0.5% one-way, that is 1% slippage + commission for a round trip
  5. Volume: only academics and efficient market believers trade on thin markets and banking holidays
  6. Borrow and uptick: structural shorts are a dime a dozen. Profitable structural shorts are the unicorns of short-selling. If You find one, capture it safely and let’s study it

The journey:
The first part of the journey is to get the signal right. This is where most people stop. They identify a signal that they test across a population of stocks one after the other. This may seem fine in theory but in practice You will rapidly come across a concept called Buying Power. If You don’t have the cash, You can’t execute. If You can’t execute, then it’s all academic. This excludes primitve versions of Matlab, MT4 and older versions of TradeStation
Math formula for that level is: Signal Validity = Win%

Second stage is when You start testing at portfolio level
You have realised that signals must be executable to be worth anything.
At this stage, You will test signals. These are where most people stop. This is the province of most sell-side quants using R or Matlab. Tradestation does not go any further. Not sure about Ninja, never tested that one
It assumes all positions are equal weight. This is primitive
math is  Win rate = Win% – Loss %
Bloomberg BTST is a rudimentary version of that

Third stage is when You start working on the real trading edge formula
Trading Edge = Win% *Avg Win% -Loss%* Avg Loss%
This is when You start to realise that size does matter in the markets, particularly when strategy fails to deliver.
At this stage, there are only two platforms which deliver: WealthLab Developer and Amibroker. Both have a comprehensive position sizing library.
Matlab can deliver but You will need to buy an additional expensive module. Matlab is an expensive guillotine, hardly suitable for neurosurgery. I do not recommend it.
WealthLab and amibroker are both C#. They both have canned strategies You can learn from and a vibrant community.

Personally WealthLab changed my life. It permanently changed the way I perceive the markets.

A word about optimisation: the masala smoothie approach
When I started working on the strategy, I, as everyone else, ventured on the side of complexity. I resorted to optimistion to find the best indicator value.

Most people, most quants, love to optimise and re-reoptimise and re-re-optimise their optimisations.
Bad news: it gives the right mathematical answer to the wrong question. Optimisation is the monosodium glutamate MSG of strategies: it gives depth and substance to poor quality food.
Work on the logic, not on the value of some hypothetical Billion Dollar idea.
Do not throw everything in hoping it will stick. Optimisers will waterboard the data until it confesses everything

PS: 100% Free Kick -A@#resource:
Andrew Swanscott interviewed me on Better System Trader.
Interview with Laurent Bernut – Better System Trader
Off line, he suggested I should offer something to his audience. Here is a tool I use daily.

The Trading Edge Visualiser User’s Manual
The way to use it to load your backtest data and look at distribution. I use this tool many times a day during strategy development.

What programs are usually used to back-test trading strategies?

The Trading Edge Visualiser User’s Manual

It is impossible to survive in the markets without an edge. Let alone being able to quantify it. How do You know if You even have an edge ?  If You want to articulate a better strategy, You need to 1) understand where your trading edge comes from, 2) quantify it and then 3) gradually improve it. Sharpe, Sortino or Treynor ratios may provide some comfort, but these are just sterile numbers. The smoothie approach of blending indicators and factors into an optimiser has never led to robust breakthroughs. Our brain remembers stories, associates images and concepts. If You can visualise your trading edge, quantify then You will be able to will be able to a better strategy.
The tool I am about to share simply changed my life. It permanently changed the way I approach markets and strategy development. It enabled me to reclassify strategies in two buckets. It then enabled me to understand the pros and cons of each. From there, it showed me the way to improve my trading edge by gradually nudging the distribution. This file is still very much part of my daily development kit. For example, in the summer of 2015 we realised there were many false positives very close to the break even line. We modified just 2 lines in the program, win rate improved by 5% points. This has enabled us to trade higher periodicity while keeping a high win rate.
The Trading Edge Visualiser tool is free. (You may be asked to reconfirm your mail-address, but it is 100% free). It is designed to be simple and intuitive. It will help You
  1. visualise your dominant trading style: mean reversion or trend following
  2. visualise and quantify your trading edge both in aggregate and at individual security level
  3. materially improve your trading edge: we posted some techniques and tips. Try them and see the results for yourself

The trading edge formula

Whatever You believe your trading edge comes from, it can be expressed in this simple formula
      Trading Edge = Win% * Avg Win – Loss% * Avg Loss
The Trading Edge Visualiser is a visual representation of the trading edge. It shows two distributions: absolute P&L and contribution. Contribution is simply P&L divided by Equity.
Green and Orange bars show Buy and Sell (Long & Short) trades. Blue and mauve bars show AVG win, AVG Loss for BUY & SELL. The middle bar is BUY & SELL Trading Edge.

Visual representations of the trading edge of the  styles

Irrespective of instruments traded, there are only two major types of strategies: mean reversion or trend following.

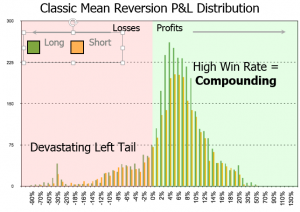
Mean reversion 

Gain Expectancy - Classic Mean reversion
Mean reversion strategies have a Moby Dick shape like distribution:
  1. the hump of the win rate is above the 50% hit ratio line
  2. The long left tail looks like a fin.


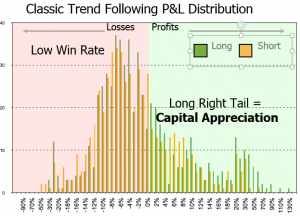
 Trend Following

Gain Expectancy - Classic Trend FollowingTrend following strategies have those characteristics
  1. Low win rates: between 30 to 40%. The peak of the loss rate is below the 50% line
  2. Short left tail
  3. Long right tail

 Step 1: Diagnostic

“If You don’t know who You are, the markets are a very expensive place to find out”, Adam Smith
Both Abebe Bikila, the barefoot Ethiopian marathonian, and Hussain Bolt run fast. Yet, marathonians are not good sprinters and vice versa. Similarly, we all have our own trading personality.
The story we tell ourselves about our style and what our trading history shows are two separate things. It is not uncommon to find “value” guys chasing momentum. Neither is it rare to find “momentum” guys doubling down on “cheap” stocks. The first step is to take an honest look at your dominant style. This tool is as honest as the scale in your bathroom.
Process your trading history on the Trading Edge Visualiser. Compare your distribution with the above major dominant styles: mean reversion or trend following.
 

Step 2: Understand and measure the risks associated with your dominant style

Risk is not a dissertation in an investment thesis. Risk is a number. The difficulty is to pick the formula will adequately match the risk associated with your style.
Sharpe, Treynor et al do not measure risk. They measure volatility of returns and naively assimilate volatility with risk. They may have some marginal utility for asset allocation purposes, but certainly not when it comes to quantifying risk.
Relevant risk measures:
  1. Mean reversion: The key risk measure for mean reversion strategies is the Tail Ratio. Tail ratios of 0.3 and below present severe risk of blow-ups. For example, some strategies may clock +0.5% every month, but have a sudden -4% drawdown. This would take 8 months to recover, which is probably beyond the patience threshold of many investors.
  2. Trend following: The key risk measure for trend following strategies is the Gain to Pain Ratio: trend following strategies have low win rates. For example, if You allow each loser to dent your capital by -1%, assuming a 40% win rate, winners will have to average +1.5% just to break even.
Common Sense Ratio
“Common sense is not so common these days”, Voltaire, French freedom fighter
One fine Monday morning at 9 am, I had the honour to meet Jack Schwager. I had just finished his book on risk so I was eager to show him my concocted risk measure. He murmured: “hmm, common sense”. A few days later, I showed it to my boss who cared to elaborate: “hmm, it makes good common sense”. Voila: Common Sense Ratio.
     CSR = Tail Ratio * Gain to Pain Ratio
Lose money 1 < CSR < 1 Make money
CSR is a notable improvement on the tail ratio as it will also capture aggregate profit ratio, or the ability to recover from big losses. It will recapture the inherent cyclicality of trend following strategies via mediocre GPR but high tail ratio.

Step 3: Improve your trading edge

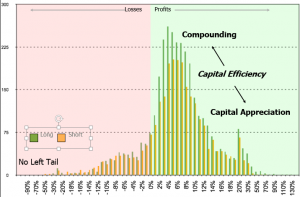
Techniques explained below are designed to nudge the shape of your distribution. Your trading edge is the shape of your distribution. Ideally, You want something that looks like this:

  1. High win rate: not only does it feel better, but it compounds fasterGain Expectancy - Alpha Secure
  2. Long right tail: ride your winners and allow your capital to appreciate
  3. No left tail: cut your losers
  4. Symmetrical distribution on the Long & Short side: identical rules on both sides of the book


Mean reversion

The key to success for mean reversion strategies is to increase the tail ratio. This can be accomplished in two ways:

  1. Stop loss: a strategy without a stop loss is like a car without brakes. As a rule of thumb, a stop loss should not be further away then twice the 90th percentile of your profits. Beyond that limit, the period of recovery may be too long to be commercially acceptable
  2. Elongate your right tail: mean reversion strategies do not allow winners to fully mature. This simple technique can allow winners to develop while preserving profits. Instead of closing the entire position, close no more than 2/3 and place a trailing technical stop loss on the remainder. Do not place a valuation stop loss as it will exceed your comfort zone.
 Moral of the story:
  1. Shops do not restock on products they cannot sell; they mark down the inventory and clear it at a discount. Similarly, do not double down on losers, accept your loss and move on.
  2. “Value” investors usually sell their positions to their “momentum” colleagues, only to sigh in despair when prices subsequently double or triple. Next time, sell them a portion of your holdings and enjoy the ride with them. Worse case scenario, if it does not work, your stop loss will take you out and protect your profit.

Trend Following

Profits look big only to the extent that losses are kept small. So, all You have to do is to manage losses and profits will take care of themselves.
  1. Stop Loss is the second most important variable in your trading system, after the most volatile place on the market, that is the grey box between your left and right earlobes. Stop loss has a direct impact on three out of four components of the trading edge: Win rate, Avg Win, Loss rate. Make a habit of placing your stop loss as your enter your orders
  2. Would You allow tenants to stay rent free in a building You own ? Every time You say yes to a free loader, You say no to a good customer, so make a habit of evicting poor performers
  3. Improve your win rate: assuming average loss stays the same, any improvement in the win rate will have a material impact on the trading edge.
Real life example: i am a short seller. The short side is plagued by periodic tidal waves called short squeezes.  The Trading Edge Visualiser taught me that rather fighting them, it made more sense to use them. I wait for the short squeeze to pass and only after that do I enter at a higher level. Then, as the next short squeeze approaches, I reduce size. This clocks a small win, reduces risk and allows to weather squeezes. Once the squeeze is over, there is a fresh high probability entry point.
This habit of scaling-out and scaling-in tilts the P&L distribution to something like the distribution at the beginner of the paragraph. It combines the high win rate of mean reversion strategies but still has long right tail, short left tail.

File user’s manual

 The Trading Edge Visualiser was built using Metatrader 4 OrderLog. It can be applied to any trading history, provided You load data in the fields coloured in blue and reset the pivot table

 Data load

  • Time and Date: the information is organised in chronological order on the Table sheet
  • Ticket No: this assumes that all trades have a unique identifier
  • Symbol: The table sheet calculates the trading edge of each security in a timely manner
  • Type: Buy/Sell, this allows rapid sort
  • Buy/Sell Lots: this field is useful for multiple entries/exits
  • Profit: this is an absolute USD P&L
  • Contribution: this is a simple P&L / Contribution field. There is no currency conversion, benchmarking or modified-Dietz time-series. Relative performance calculation should take place in this field

 Pivot Table settings

  • ROW fields in Tabular Form: In the PivotTableFields: click on Field Settings: in Layout & Print table: Click on Show items in tabular form
  • ROW Fields SubTotals deactivated: In the PivotTableFields: click on Field Settings: SubTotal & Filters table, Subtotals: click None
  • PivotTable Options Totals Columns deactivated: Right-click anywhere in the PivotTable, go to Totals & Filters, uncheck Show grand totals for columns
  • Column Label: Click on Select All to allow automatic refreshing
 Useful tips:
  1. Run this analysis periodically and keep track of your evolution to receive the full benefits
  2. Truncate data: the current file looks at the entire population. Segment your trading history into blocks when your strategy performs, when it does not.
  3. Comment and annotate entries/exits. You will realise that a bit of finesse on exit will go a long way. It is useful to keep track of exits

Conclusion

People who keep track of their weight are 30% more susceptible to reach their weight loss target. The Trading Edge Visualiser tool will help You understand who You really are. It has the potential to transform your trading game, as it continues to do so for me.

It is 100% free, so download and play with it!