Our Research
The world does not need yet another market commentator. Our tools are designed to help investors along their investment journey
- Signals: trend reversal signals (Bull/Bear) on equity indices, Forex and government bonds
- Trading systems: simple steps from concept, back tests to auto-trade
- Money management: bet sizing algorithms, money/risk management tools
- Psychology: research and practical tools on habit formation
- Topics: discussions on the industry, trends
What the great Chinese philosopher Bruce Lee can teach Fund managers about mastery
Answer by Laurent Bernut: This was originally a question on QUORA: which investment method is the best ?
As the Great Chinese philosopher Bruce Lee said: “have the style of no style, be water my friend”
There are two games of trading: outer and inner game of trading
Stage 0: Dunning Kruger effect
The Dunning Kruger effect is a cognitive bias where unskilled individuals believe in their illusory superiority. It is often found in senior management of old listed companies such as Volkswagen, Kodak, Sony etc. When Bruce Lees did not know anything about Wing Tsun, he thought a punch was merely a punch. After he had internalised his craft, a punch became just a punch.
In the beginning, anyone thinks the stock market is easy. Then they lose
Stage 1: Exploration
Bruce Lee not only explored Wing Tsun, but also English boxing, karate.
At this stage, market students embark on an exploratory phase to build a syncretism of what they think is best.Stage 2: Perfection
This is the most common mistake of all outer game centered practice. Students perfect their craft and believe their style beats any other style out there. MMA is better than Brazilian Jiu Jitsu. Kyokushinkai is more resilient among karate etc.
Still, students myopically concentrate on their microscopic universe and fail to embrace diversity. They may be outwardly good, but they are still trapped in the outer game.Stage 3: Acceptance
Responding to a challenge from other Kung Fu teachers, Bruce Lee defeated his opponent in a whooping 3 minutes. In doing so, he injured himself and pestered about how long it took. He then proceeded to enrich his repertoire.
This is the first stage of inner game. This is where internalization and deep learning starts.
This is the essence of the “10,000 hours”. This is where “flow state” happens. Students redefine their identity. They free themselves from the confine of the style they used to practice.Stage 4: Mastery “Be water my friend”
At this stage, students redefine the game. They bend reality. It becomes effortless. Master traders and investors have redefined their game. They have a congruent universe governed by a simple set of rules.So, in conclusion, there is no superior method: fundamental, quantitative, technical, HFT, etc. There is a better method for You that suits your personality. It is incumbent upon You to find your path on the markets. Believing that fundamental or technical analysis is the way to succeed, just because everyone else around is doing it, will not work. They are also struggling. A long journey on the markets begins in stillness
What programs are usually used to back-test trading strategies?
Answer by Laurent Bernut:
Testing a strategy is a journey. For any journey, You need the right equipment. I test everything on WealthLab then program on other platforms. Here is why
The objective of back-testing is to simulate real trading. When You trade real money, You face the following problems:
- Position size: You do not trade 1 share per trade. You may have sophisticated position sizing algo. Platforms offering position sizing algos in back-testing phase are few and far between: WealthLab & amiBroker. QuantConnect and Quantopian may but I have not tried
- Cash constraint: You strategy may generate signals but if You do not have cash to execute either a Buy Long or a Buy to Cover, it is a moot point. WLD and amiBroker
- Portfolio rotation: this is similar to the above point. Test may look great/poor on one security but in real life, you trade a portfolio.
- Slippage & commission: always set slippage at max. My settings is -0.5% one-way, that is 1% slippage + commission for a round trip
- Volume: only academics and efficient market believers trade on thin markets and banking holidays
- Borrow and uptick: structural shorts are a dime a dozen. Profitable structural shorts are the unicorns of short-selling. If You find one, capture it safely and let’s study it
The journey:
The first part of the journey is to get the signal right. This is where most people stop. They identify a signal that they test across a population of stocks one after the other. This may seem fine in theory but in practice You will rapidly come across a concept called Buying Power. If You don’t have the cash, You can’t execute. If You can’t execute, then it’s all academic. This excludes primitve versions of Matlab, MT4 and older versions of TradeStation
Math formula for that level is: Signal Validity = Win%Second stage is when You start testing at portfolio level
You have realised that signals must be executable to be worth anything.
At this stage, You will test signals. These are where most people stop. This is the province of most sell-side quants using R or Matlab. Tradestation does not go any further. Not sure about Ninja, never tested that one
It assumes all positions are equal weight. This is primitive
math is Win rate = Win% – Loss %
Bloomberg BTST is a rudimentary version of thatThird stage is when You start working on the real trading edge formula
Trading Edge = Win% *Avg Win% -Loss%* Avg Loss%
This is when You start to realise that size does matter in the markets, particularly when strategy fails to deliver.
At this stage, there are only two platforms which deliver: WealthLab Developer and Amibroker. Both have a comprehensive position sizing library.
Matlab can deliver but You will need to buy an additional expensive module. Matlab is an expensive guillotine, hardly suitable for neurosurgery. I do not recommend it.
WealthLab and amibroker are both C#. They both have canned strategies You can learn from and a vibrant community.Personally WealthLab changed my life. It permanently changed the way I perceive the markets.
A word about optimisation: the masala smoothie approach
When I started working on the strategy, I, as everyone else, ventured on the side of complexity. I resorted to optimistion to find the best indicator value.Most people, most quants, love to optimise and re-reoptimise and re-re-optimise their optimisations.
Bad news: it gives the right mathematical answer to the wrong question. Optimisation is the monosodium glutamate MSG of strategies: it gives depth and substance to poor quality food.
Work on the logic, not on the value of some hypothetical Billion Dollar idea.
Do not throw everything in hoping it will stick. Optimisers will waterboard the data until it confesses everythingPS: 100% Free Kick -A@#resource:
Andrew Swanscott interviewed me on Better System Trader.
Interview with Laurent Bernut – Better System Trader
Off line, he suggested I should offer something to his audience. Here is a tool I use daily.The Trading Edge Visualiser User’s Manual
The way to use it to load your backtest data and look at distribution. I use this tool many times a day during strategy development.
What programs are usually used to back-test trading strategies?
The Trading Edge Visualiser User’s Manual
- visualise your dominant trading style: mean reversion or trend following
- visualise and quantify your trading edge both in aggregate and at individual security level
- materially improve your trading edge: we posted some techniques and tips. Try them and see the results for yourself
The trading edge formula
Visual representations of the trading edge of the styles
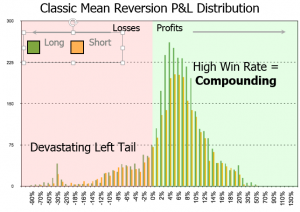
Mean reversion
- the hump of the win rate is above the 50% hit ratio line
- The long left tail looks like a fin.
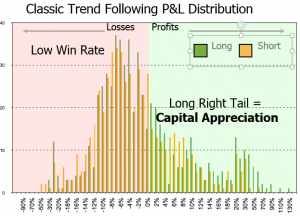
Trend Following
- Low win rates: between 30 to 40%. The peak of the loss rate is below the 50% line
- Short left tail
- Long right tail
Step 1: Diagnostic
Step 2: Understand and measure the risks associated with your dominant style
- Mean reversion: The key risk measure for mean reversion strategies is the Tail Ratio. Tail ratios of 0.3 and below present severe risk of blow-ups. For example, some strategies may clock +0.5% every month, but have a sudden -4% drawdown. This would take 8 months to recover, which is probably beyond the patience threshold of many investors.
- Trend following: The key risk measure for trend following strategies is the Gain to Pain Ratio: trend following strategies have low win rates. For example, if You allow each loser to dent your capital by -1%, assuming a 40% win rate, winners will have to average +1.5% just to break even.
Step 3: Improve your trading edge
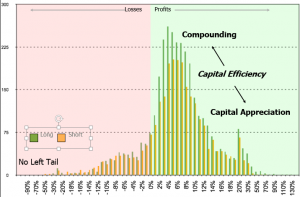
Techniques explained below are designed to nudge the shape of your distribution. Your trading edge is the shape of your distribution. Ideally, You want something that looks like this:
- High win rate: not only does it feel better, but it compounds faster

- Long right tail: ride your winners and allow your capital to appreciate
- No left tail: cut your losers
- Symmetrical distribution on the Long & Short side: identical rules on both sides of the book
Mean reversion
The key to success for mean reversion strategies is to increase the tail ratio. This can be accomplished in two ways:
- Stop loss: a strategy without a stop loss is like a car without brakes. As a rule of thumb, a stop loss should not be further away then twice the 90th percentile of your profits. Beyond that limit, the period of recovery may be too long to be commercially acceptable
- Elongate your right tail: mean reversion strategies do not allow winners to fully mature. This simple technique can allow winners to develop while preserving profits. Instead of closing the entire position, close no more than 2/3 and place a trailing technical stop loss on the remainder. Do not place a valuation stop loss as it will exceed your comfort zone.
- Shops do not restock on products they cannot sell; they mark down the inventory and clear it at a discount. Similarly, do not double down on losers, accept your loss and move on.
- “Value” investors usually sell their positions to their “momentum” colleagues, only to sigh in despair when prices subsequently double or triple. Next time, sell them a portion of your holdings and enjoy the ride with them. Worse case scenario, if it does not work, your stop loss will take you out and protect your profit.
Trend Following
- Stop Loss is the second most important variable in your trading system, after the most volatile place on the market, that is the grey box between your left and right earlobes. Stop loss has a direct impact on three out of four components of the trading edge: Win rate, Avg Win, Loss rate. Make a habit of placing your stop loss as your enter your orders
- Would You allow tenants to stay rent free in a building You own ? Every time You say yes to a free loader, You say no to a good customer, so make a habit of evicting poor performers
- Improve your win rate: assuming average loss stays the same, any improvement in the win rate will have a material impact on the trading edge.
File user’s manual
Data load
- Time and Date: the information is organised in chronological order on the Table sheet
- Ticket No: this assumes that all trades have a unique identifier
- Symbol: The table sheet calculates the trading edge of each security in a timely manner
- Type: Buy/Sell, this allows rapid sort
- Buy/Sell Lots: this field is useful for multiple entries/exits
- Profit: this is an absolute USD P&L
- Contribution: this is a simple P&L / Contribution field. There is no currency conversion, benchmarking or modified-Dietz time-series. Relative performance calculation should take place in this field
Pivot Table settings
- ROW fields in Tabular Form: In the PivotTableFields: click on Field Settings: in Layout & Print table: Click on Show items in tabular form
- ROW Fields SubTotals deactivated: In the PivotTableFields: click on Field Settings: SubTotal & Filters table, Subtotals: click None
- PivotTable Options Totals Columns deactivated: Right-click anywhere in the PivotTable, go to Totals & Filters, uncheck Show grand totals for columns
- Column Label: Click on Select All to allow automatic refreshing
- Run this analysis periodically and keep track of your evolution to receive the full benefits
- Truncate data: the current file looks at the entire population. Segment your trading history into blocks when your strategy performs, when it does not.
- Comment and annotate entries/exits. You will realise that a bit of finesse on exit will go a long way. It is useful to keep track of exits
Conclusion
People who keep track of their weight are 30% more susceptible to reach their weight loss target. The Trading Edge Visualiser tool will help You understand who You really are. It has the potential to transform your trading game, as it continues to do so for me.
It is 100% free, so download and play with it!


